| __timestamp | Eaton Corporation plc | Pentair plc |
|---|---|---|
| Wednesday, January 1, 2014 | 3586000000 | 1109300000 |
| Thursday, January 1, 2015 | 3302000000 | 842400000 |
| Friday, January 1, 2016 | 3176000000 | 890400000 |
| Sunday, January 1, 2017 | 3418000000 | 488600000 |
| Monday, January 1, 2018 | 3875000000 | 552800000 |
| Tuesday, January 1, 2019 | 2827000000 | 513200000 |
| Wednesday, January 1, 2020 | 1674000000 | 527600000 |
| Friday, January 1, 2021 | 2423000000 | 714400000 |
| Saturday, January 1, 2022 | 3031000000 | 830400000 |
| Sunday, January 1, 2023 | 4904000000 | 852000000 |
| Monday, January 1, 2024 | 5547999771 | 803800000 |
Unlocking the unknown
In the ever-evolving landscape of industrial manufacturing, Eaton Corporation plc and Pentair plc have been pivotal players. Over the past decade, from 2014 to 2023, these companies have showcased distinct trajectories in their EBITDA performance. Eaton Corporation plc has demonstrated a robust growth pattern, with its EBITDA peaking at approximately 4.9 billion in 2023, marking a significant increase of around 37% from its 2014 figures. In contrast, Pentair plc's EBITDA has experienced fluctuations, with a notable dip in 2017, but it has managed a steady recovery, reaching about 852 million in 2023. This comparative analysis highlights Eaton's resilience and strategic growth, while Pentair's journey underscores its adaptability in a competitive market. As the industrial sector continues to innovate, these insights provide a glimpse into the financial health and strategic direction of these two industry giants.
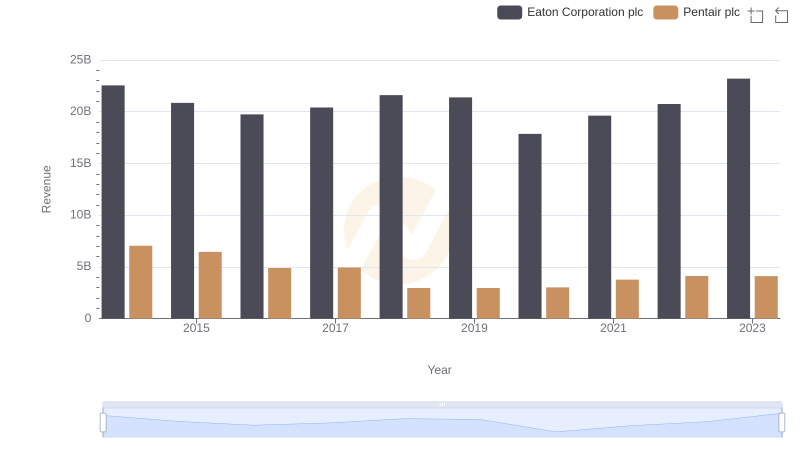
Comparing Revenue Performance: Eaton Corporation plc or Pentair plc?
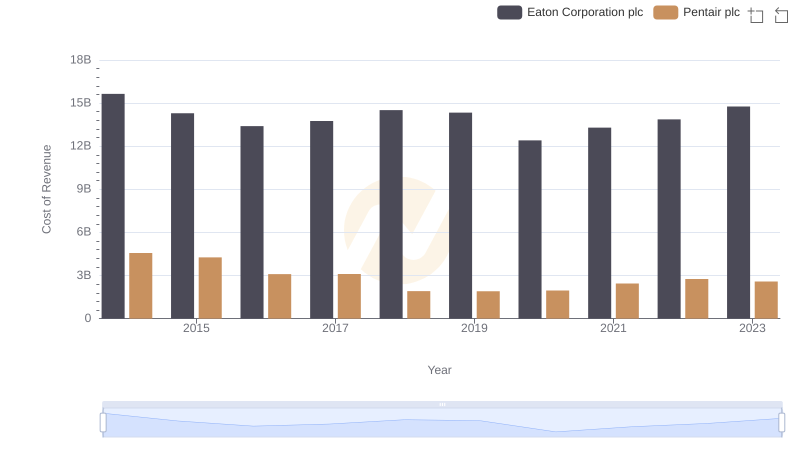
Comparing Cost of Revenue Efficiency: Eaton Corporation plc vs Pentair plc

Comparing Innovation Spending: Eaton Corporation plc and Pentair plc
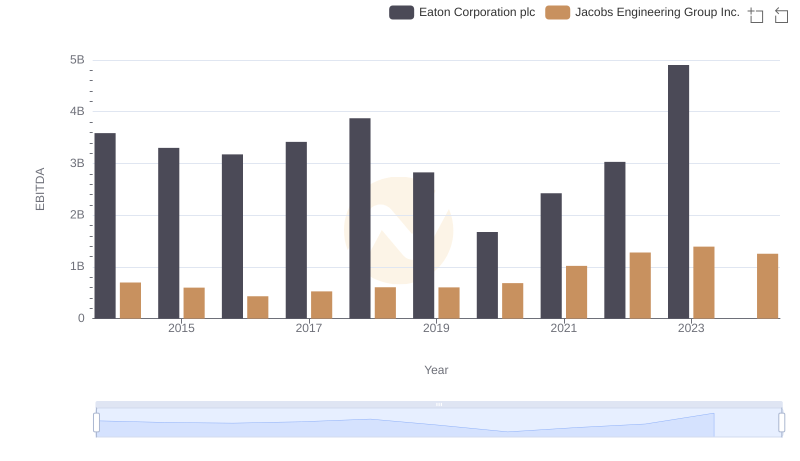
EBITDA Metrics Evaluated: Eaton Corporation plc vs Jacobs Engineering Group Inc.
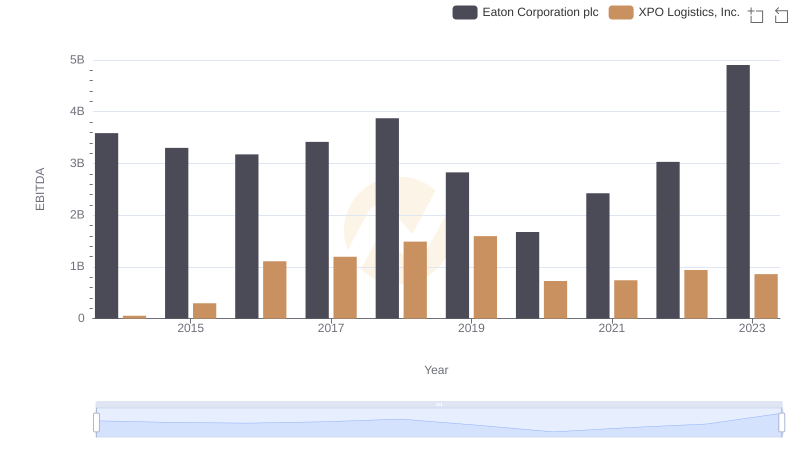
Comprehensive EBITDA Comparison: Eaton Corporation plc vs XPO Logistics, Inc.
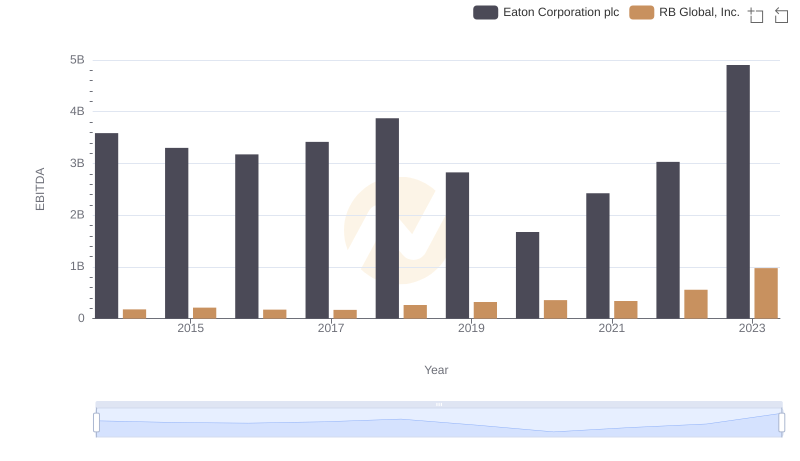
EBITDA Metrics Evaluated: Eaton Corporation plc vs RB Global, Inc.