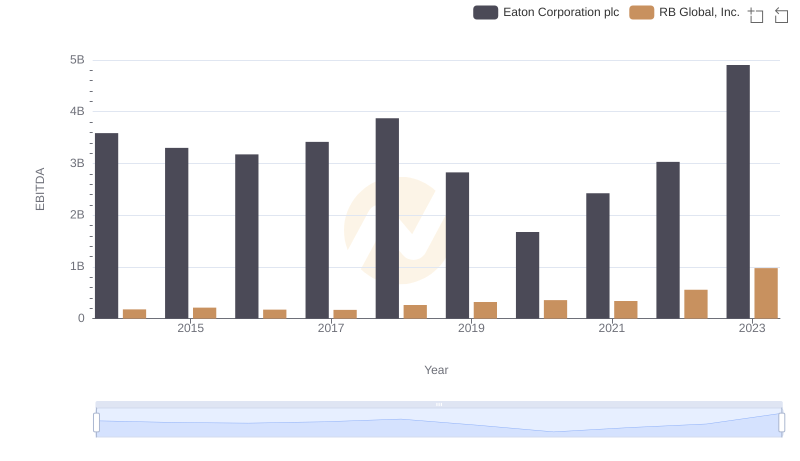
| __timestamp | Eaton Corporation plc | Textron Inc. |
|---|---|---|
| Wednesday, January 1, 2014 | 3586000000 | 1575000000 |
| Thursday, January 1, 2015 | 3302000000 | 1601000000 |
| Friday, January 1, 2016 | 3176000000 | 1484000000 |
| Sunday, January 1, 2017 | 3418000000 | 1367000000 |
| Monday, January 1, 2018 | 3875000000 | 1974000000 |
| Tuesday, January 1, 2019 | 2827000000 | 1518000000 |
| Wednesday, January 1, 2020 | 1674000000 | 827000000 |
| Friday, January 1, 2021 | 2423000000 | 1391000000 |
| Saturday, January 1, 2022 | 3031000000 | 1515000000 |
| Sunday, January 1, 2023 | 4904000000 | 1556000000 |
| Monday, January 1, 2024 | 5547999771 | 1422000000 |
Data in motion
In the ever-evolving landscape of industrial giants, Eaton Corporation plc and Textron Inc. have been pivotal players. Over the past decade, Eaton has consistently outperformed Textron in terms of EBITDA, showcasing a robust financial trajectory. From 2014 to 2023, Eaton's EBITDA saw a remarkable increase of approximately 37%, peaking in 2023. In contrast, Textron's EBITDA remained relatively stable, with a modest growth of around 1% over the same period.
The year 2020 marked a significant downturn for both companies, with Eaton's EBITDA plummeting by nearly 42% compared to the previous year, reflecting the global economic challenges. However, Eaton's recovery was swift, with a 102% surge by 2023. Textron, while resilient, experienced a more gradual recovery.
This analysis underscores Eaton's strategic resilience and adaptability, positioning it as a formidable leader in the industrial sector.