| __timestamp | Eaton Corporation plc | United Rentals, Inc. |
|---|---|---|
| Wednesday, January 1, 2014 | 22552000000 | 5685000000 |
| Thursday, January 1, 2015 | 20855000000 | 5817000000 |
| Friday, January 1, 2016 | 19747000000 | 5762000000 |
| Sunday, January 1, 2017 | 20404000000 | 6641000000 |
| Monday, January 1, 2018 | 21609000000 | 8047000000 |
| Tuesday, January 1, 2019 | 21390000000 | 9351000000 |
| Wednesday, January 1, 2020 | 17858000000 | 8530000000 |
| Friday, January 1, 2021 | 19628000000 | 9716000000 |
| Saturday, January 1, 2022 | 20752000000 | 11642000000 |
| Sunday, January 1, 2023 | 23196000000 | 14332000000 |
| Monday, January 1, 2024 | 24878000000 | 15345000000 |
Unveiling the hidden dimensions of data
In the ever-evolving landscape of industrial giants, Eaton Corporation plc and United Rentals, Inc. have carved out significant niches. Over the past decade, Eaton's revenue has shown a steady trajectory, peaking in 2023 with a 15% increase from 2014. Meanwhile, United Rentals has demonstrated a remarkable growth story, with its revenue more than doubling since 2014, reaching a new high in 2024.
Eaton's revenue dipped slightly in 2020, likely due to global economic challenges, but rebounded strongly in subsequent years. In contrast, United Rentals has consistently expanded its market share, with a notable 24% increase in revenue from 2022 to 2023 alone.
As we look to the future, the missing data for Eaton in 2024 leaves room for speculation. Will Eaton continue its upward trend, or will United Rentals maintain its rapid growth pace? Only time will tell.
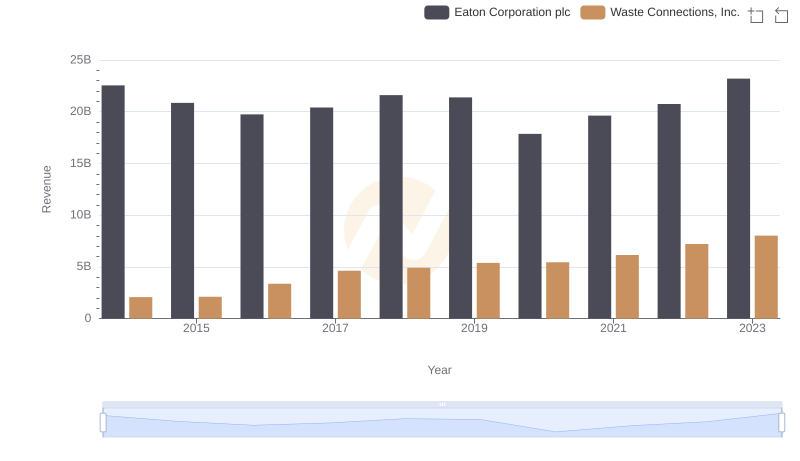
Who Generates More Revenue? Eaton Corporation plc or Waste Connections, Inc.
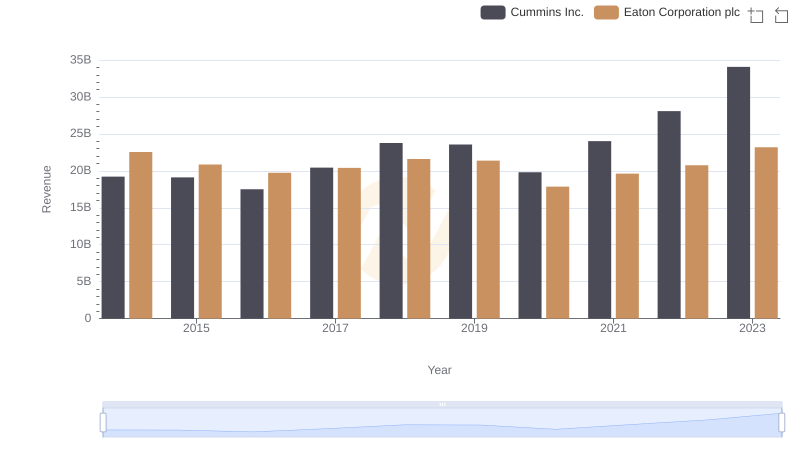
Comparing Revenue Performance: Eaton Corporation plc or Cummins Inc.?
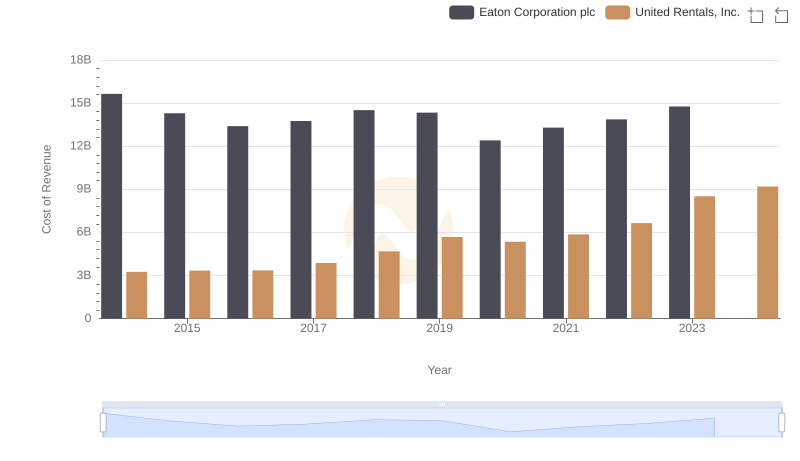
Cost Insights: Breaking Down Eaton Corporation plc and United Rentals, Inc.'s Expenses
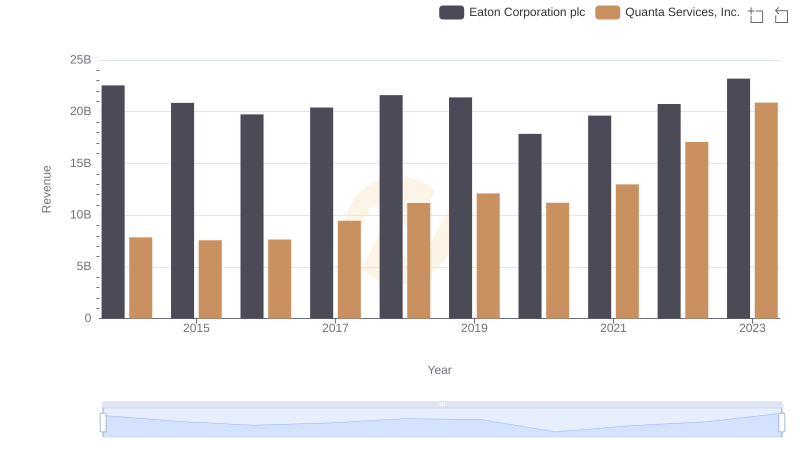
Eaton Corporation plc vs Quanta Services, Inc.: Examining Key Revenue Metrics
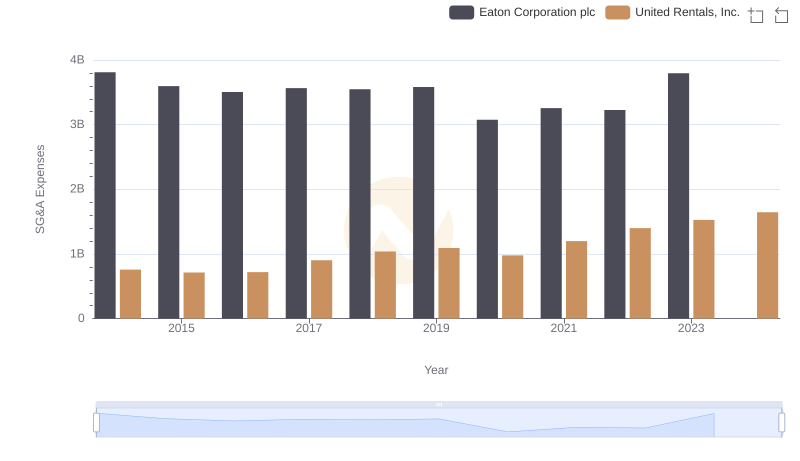
Eaton Corporation plc and United Rentals, Inc.: SG&A Spending Patterns Compared