| __timestamp | Eaton Corporation plc | United Rentals, Inc. |
|---|---|---|
| Wednesday, January 1, 2014 | 15646000000 | 3253000000 |
| Thursday, January 1, 2015 | 14292000000 | 3337000000 |
| Friday, January 1, 2016 | 13400000000 | 3359000000 |
| Sunday, January 1, 2017 | 13756000000 | 3872000000 |
| Monday, January 1, 2018 | 14511000000 | 4683000000 |
| Tuesday, January 1, 2019 | 14338000000 | 5681000000 |
| Wednesday, January 1, 2020 | 12408000000 | 5347000000 |
| Friday, January 1, 2021 | 13293000000 | 5863000000 |
| Saturday, January 1, 2022 | 13865000000 | 6646000000 |
| Sunday, January 1, 2023 | 14763000000 | 8519000000 |
| Monday, January 1, 2024 | 15375000000 | 9195000000 |
In pursuit of knowledge
In the ever-evolving landscape of industrial giants, understanding cost structures is pivotal. Eaton Corporation plc and United Rentals, Inc. have been at the forefront of this dynamic sector. From 2014 to 2023, Eaton's cost of revenue has shown a steady pattern, peaking in 2014 and 2023, with a notable dip in 2020, reflecting a 21% decrease from its 2014 high. Meanwhile, United Rentals has experienced a robust upward trajectory, with costs nearly tripling over the same period, highlighting its aggressive expansion strategy. The absence of Eaton's 2024 data suggests a potential shift or strategic realignment. This comparative analysis not only underscores the distinct operational strategies of these two industry leaders but also provides a window into the broader economic trends influencing their financial decisions.
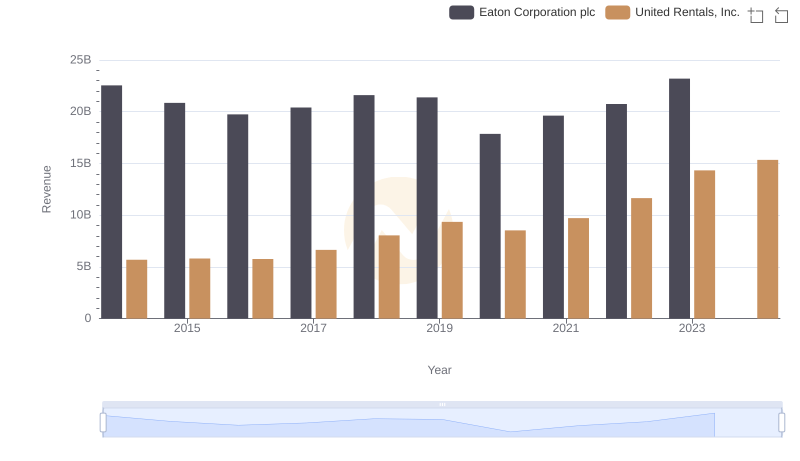
Comparing Revenue Performance: Eaton Corporation plc or United Rentals, Inc.?

Comparing Cost of Revenue Efficiency: Eaton Corporation plc vs Howmet Aerospace Inc.
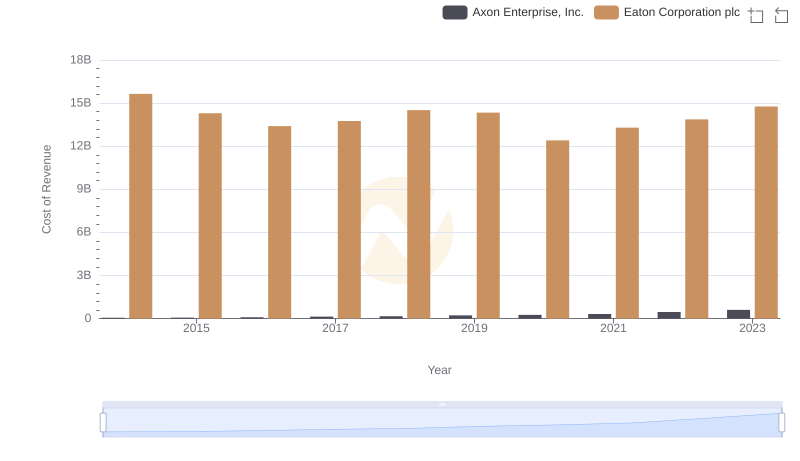
Cost of Revenue Trends: Eaton Corporation plc vs Axon Enterprise, Inc.
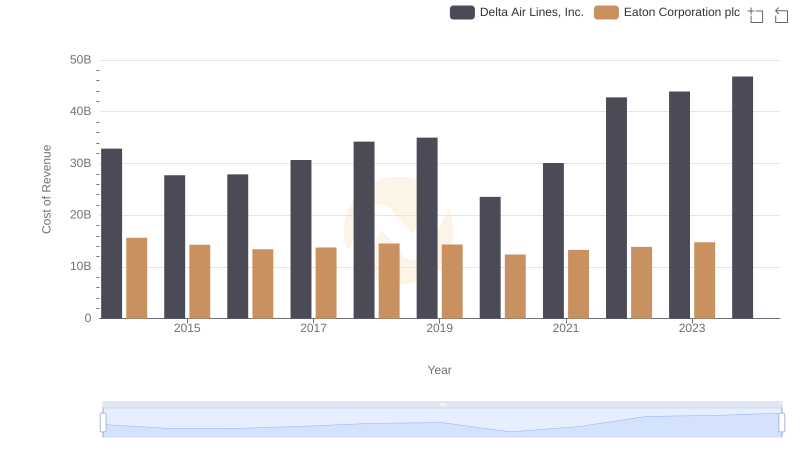
Comparing Cost of Revenue Efficiency: Eaton Corporation plc vs Delta Air Lines, Inc.
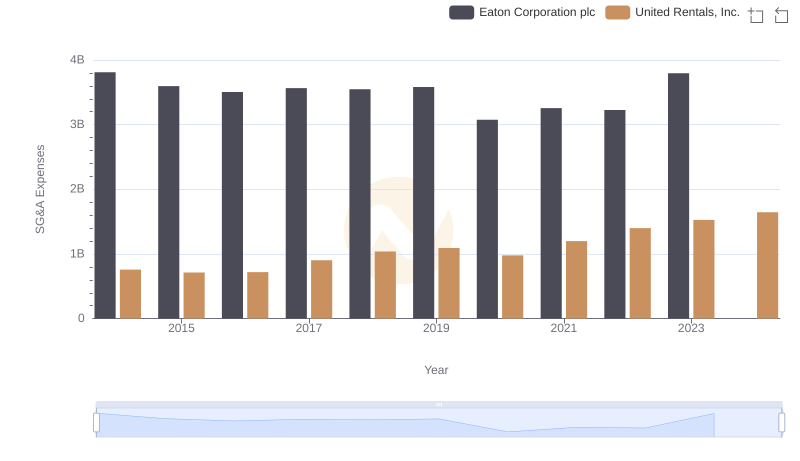
Eaton Corporation plc and United Rentals, Inc.: SG&A Spending Patterns Compared