| __timestamp | Axon Enterprise, Inc. | Eaton Corporation plc |
|---|---|---|
| Wednesday, January 1, 2014 | 62977000 | 15646000000 |
| Thursday, January 1, 2015 | 69245000 | 14292000000 |
| Friday, January 1, 2016 | 97709000 | 13400000000 |
| Sunday, January 1, 2017 | 136710000 | 13756000000 |
| Monday, January 1, 2018 | 161485000 | 14511000000 |
| Tuesday, January 1, 2019 | 223574000 | 14338000000 |
| Wednesday, January 1, 2020 | 264672000 | 12408000000 |
| Friday, January 1, 2021 | 322471000 | 13293000000 |
| Saturday, January 1, 2022 | 461297000 | 13865000000 |
| Sunday, January 1, 2023 | 608009000 | 14763000000 |
| Monday, January 1, 2024 | 15375000000 |
Igniting the spark of knowledge
In the ever-evolving landscape of industrial and technology sectors, understanding cost dynamics is crucial. Over the past decade, Eaton Corporation plc and Axon Enterprise, Inc. have showcased distinct trajectories in their cost of revenue. From 2014 to 2023, Eaton's cost of revenue has remained relatively stable, fluctuating around $14 billion annually, with a slight dip in 2020. In contrast, Axon has experienced a remarkable growth, with its cost of revenue increasing nearly tenfold, from approximately $63 million in 2014 to over $600 million in 2023. This stark contrast highlights Axon's aggressive expansion and scaling strategies, while Eaton's stability reflects its established market presence. As we delve into these trends, it becomes evident that while Eaton maintains its stronghold, Axon's rapid growth trajectory positions it as a formidable player in the industry.

Comparing Cost of Revenue Efficiency: Eaton Corporation plc vs Howmet Aerospace Inc.
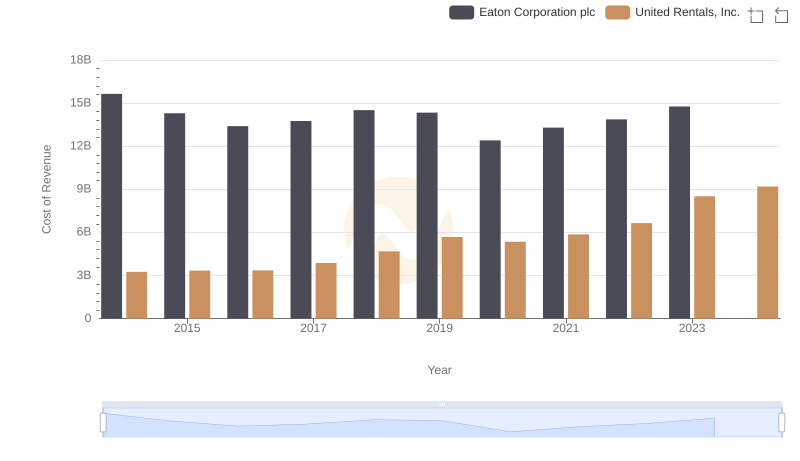
Cost Insights: Breaking Down Eaton Corporation plc and United Rentals, Inc.'s Expenses
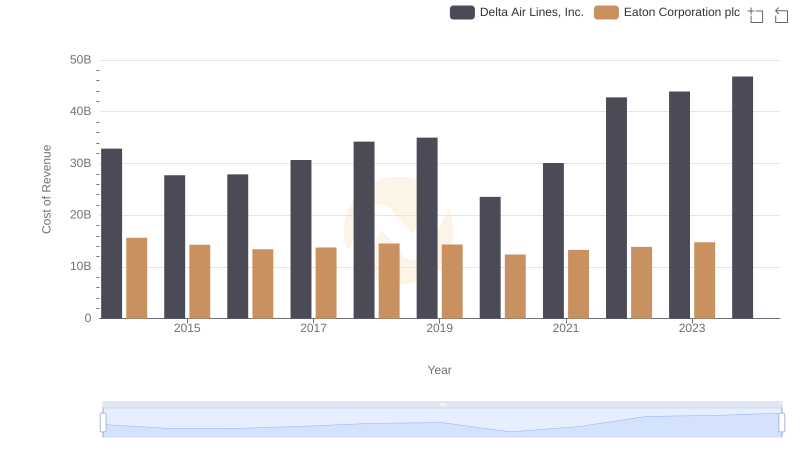
Comparing Cost of Revenue Efficiency: Eaton Corporation plc vs Delta Air Lines, Inc.
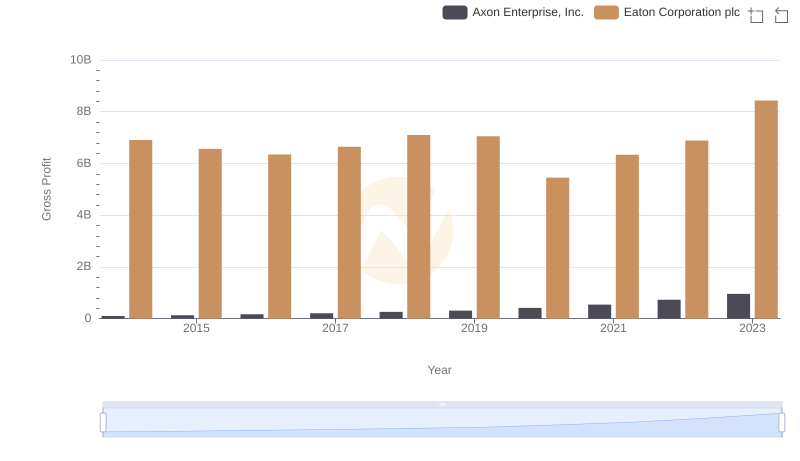
Gross Profit Analysis: Comparing Eaton Corporation plc and Axon Enterprise, Inc.
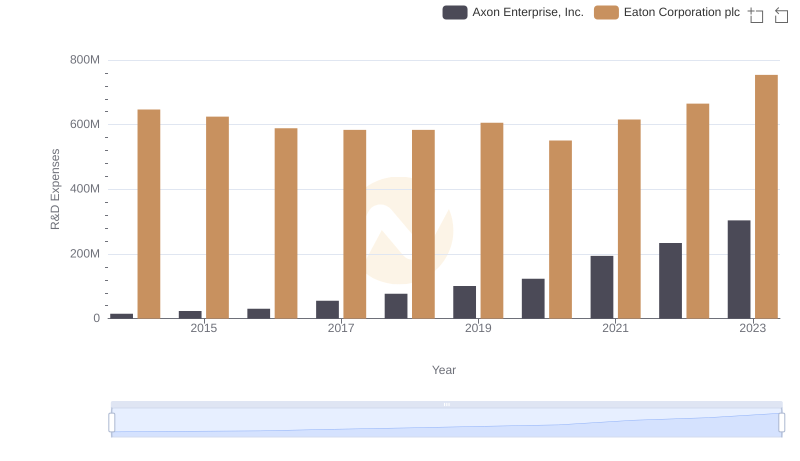
Eaton Corporation plc or Axon Enterprise, Inc.: Who Invests More in Innovation?