| __timestamp | Teledyne Technologies Incorporated | Wipro Limited |
|---|---|---|
| Wednesday, January 1, 2014 | 1487100000 | 321284000000 |
| Thursday, January 1, 2015 | 1427800000 | 356724000000 |
| Friday, January 1, 2016 | 1308800000 | 391544000000 |
| Sunday, January 1, 2017 | 1612200000 | 385575000000 |
| Monday, January 1, 2018 | 1791000000 | 413033000000 |
| Tuesday, January 1, 2019 | 1920300000 | 436085000000 |
| Wednesday, January 1, 2020 | 1905300000 | 423205000000 |
| Friday, January 1, 2021 | 2772900000 | 555872000000 |
| Saturday, January 1, 2022 | 3128300000 | 645446000000 |
| Sunday, January 1, 2023 | 3196100000 | 631497000000 |
| Monday, January 1, 2024 | 631497000000 |
In pursuit of knowledge
In the ever-evolving landscape of global technology, understanding the cost of revenue is crucial for evaluating a company's financial health. This analysis focuses on two industry giants: Wipro Limited and Teledyne Technologies Incorporated, from 2014 to 2023.
Wipro Limited, a leader in IT services, has shown a consistent upward trend in its cost of revenue. From 2014 to 2023, Wipro's cost of revenue increased by nearly 97%, reflecting its expanding operations and market reach. The peak was observed in 2022, with a slight dip in 2023, indicating potential strategic shifts or market conditions.
Teledyne Technologies, known for its innovative solutions, experienced a 115% rise in cost of revenue over the same period. The most significant growth occurred between 2020 and 2022, suggesting a robust response to market demands. However, data for 2024 is missing, leaving room for speculation on future trends.
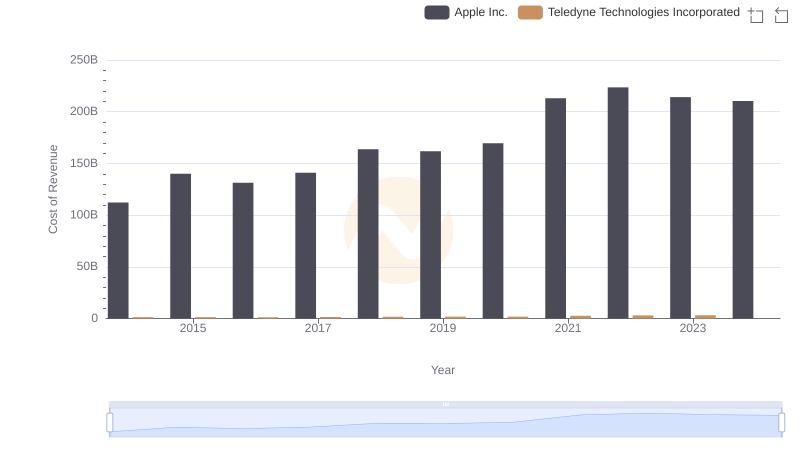
Analyzing Cost of Revenue: Apple Inc. and Teledyne Technologies Incorporated
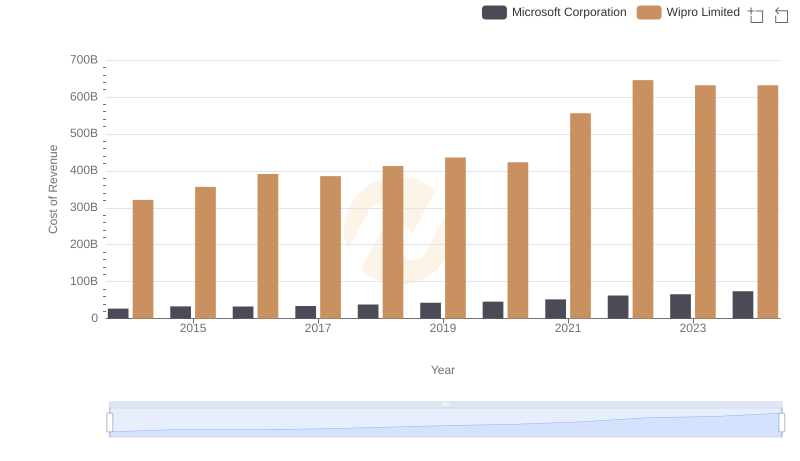
Cost of Revenue: Key Insights for Microsoft Corporation and Wipro Limited
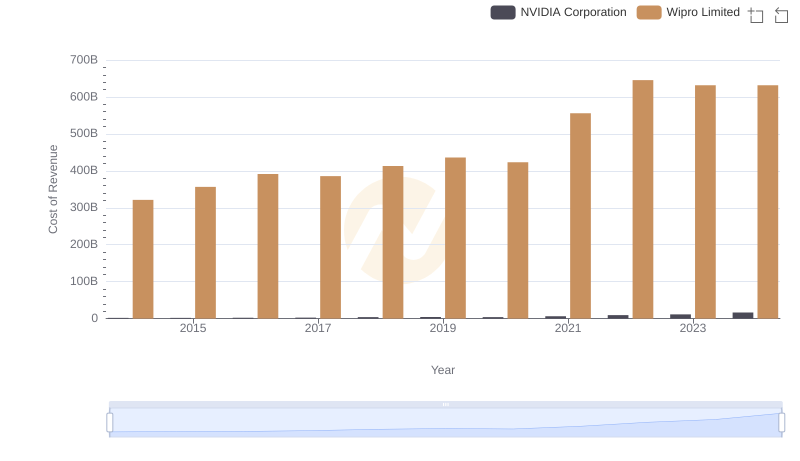
Cost of Revenue Comparison: NVIDIA Corporation vs Wipro Limited
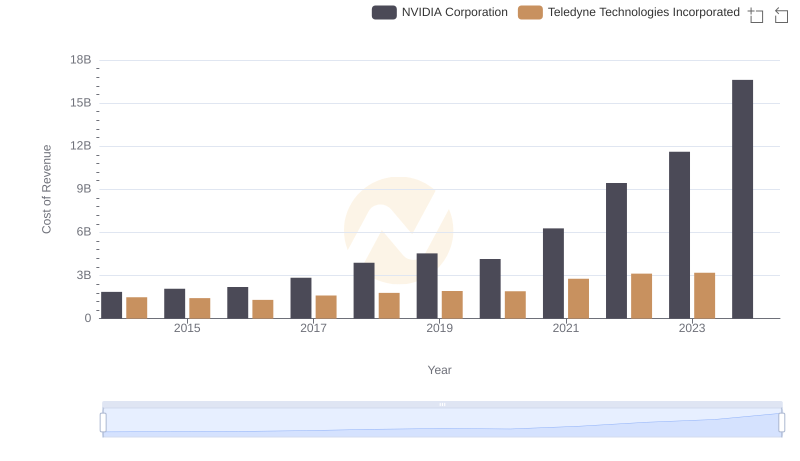
Cost of Revenue Comparison: NVIDIA Corporation vs Teledyne Technologies Incorporated
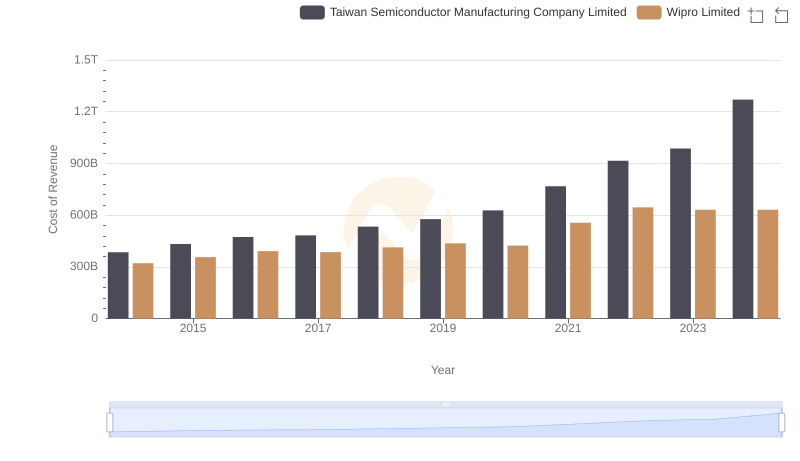
Cost of Revenue Comparison: Taiwan Semiconductor Manufacturing Company Limited vs Wipro Limited
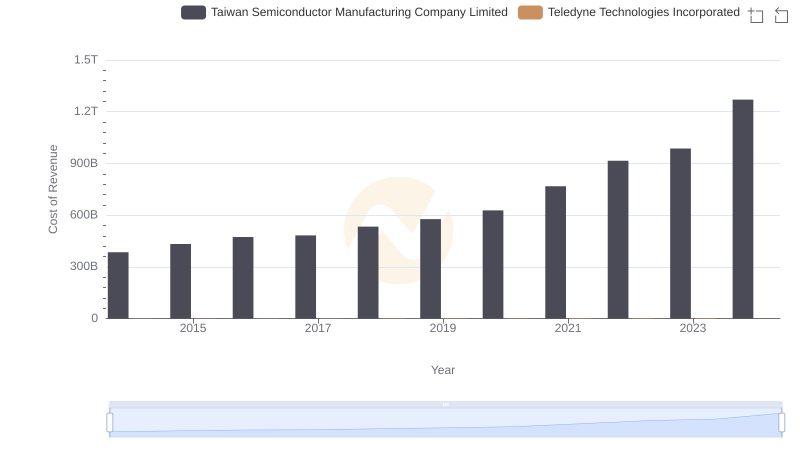
Analyzing Cost of Revenue: Taiwan Semiconductor Manufacturing Company Limited and Teledyne Technologies Incorporated
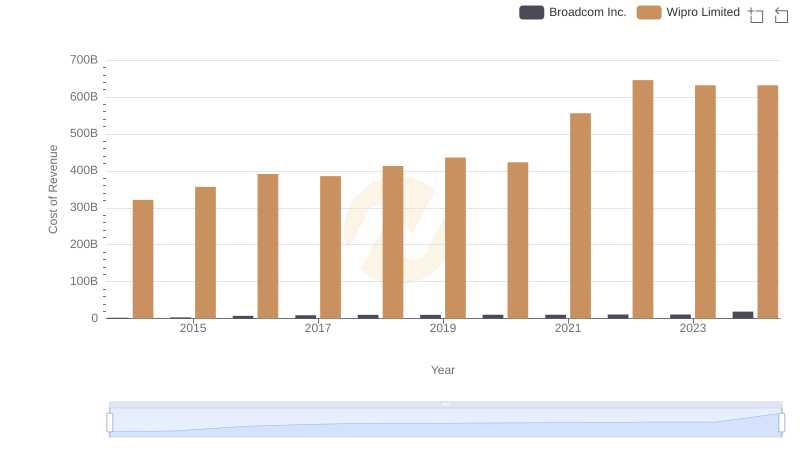
Comparing Cost of Revenue Efficiency: Broadcom Inc. vs Wipro Limited
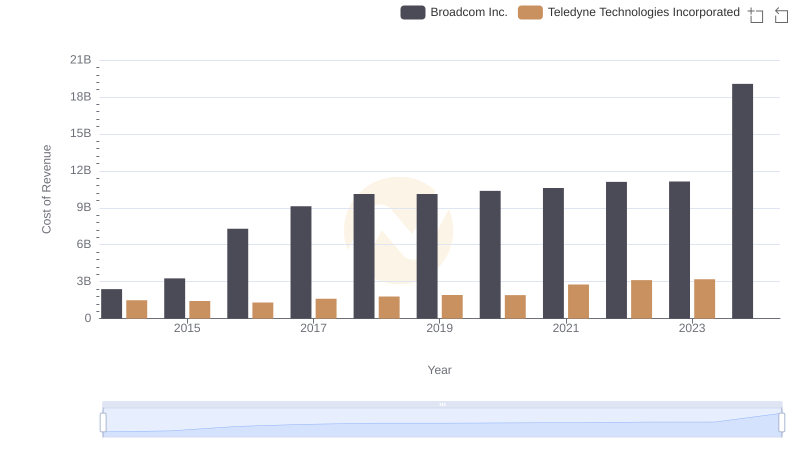
Broadcom Inc. vs Teledyne Technologies Incorporated: Efficiency in Cost of Revenue Explored

Revenue Showdown: Wipro Limited vs Teledyne Technologies Incorporated
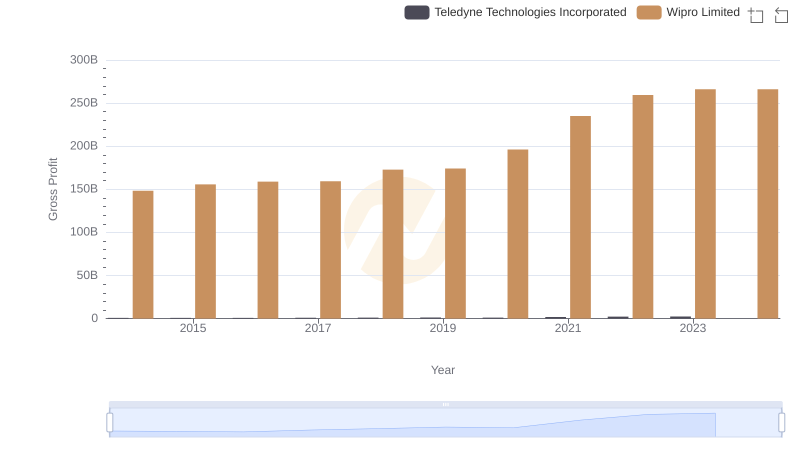
Gross Profit Trends Compared: Wipro Limited vs Teledyne Technologies Incorporated
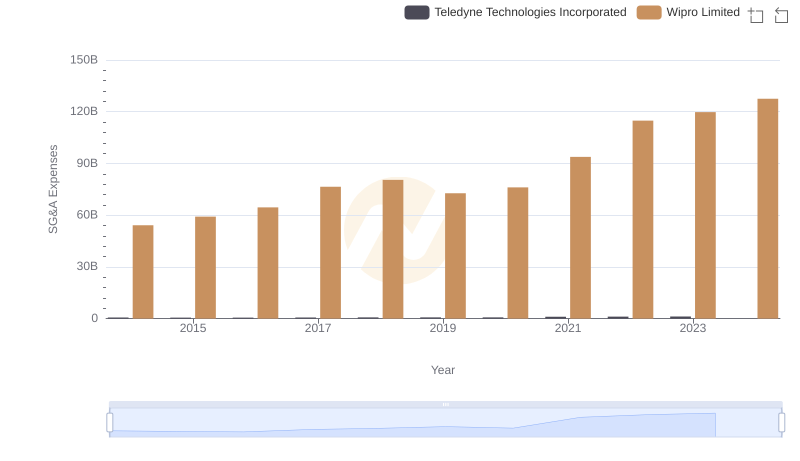
Selling, General, and Administrative Costs: Wipro Limited vs Teledyne Technologies Incorporated
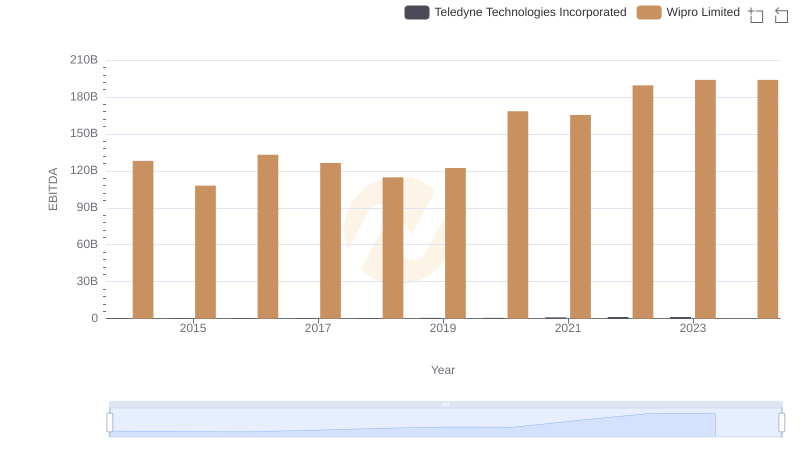
EBITDA Performance Review: Wipro Limited vs Teledyne Technologies Incorporated