| __timestamp | Super Micro Computer, Inc. | Telefonaktiebolaget LM Ericsson (publ) |
|---|---|---|
| Wednesday, January 1, 2014 | 1241657000 | 145556000000 |
| Thursday, January 1, 2015 | 1670924000 | 161101000000 |
| Friday, January 1, 2016 | 1884048000 | 156243000000 |
| Sunday, January 1, 2017 | 2171349000 | 156758000000 |
| Monday, January 1, 2018 | 2930498000 | 142638000000 |
| Tuesday, January 1, 2019 | 3004838000 | 142392000000 |
| Wednesday, January 1, 2020 | 2813071000 | 138666000000 |
| Friday, January 1, 2021 | 3022884000 | 131565000000 |
| Saturday, January 1, 2022 | 4396098000 | 158251000000 |
| Sunday, January 1, 2023 | 5840470000 | 161749000000 |
| Monday, January 1, 2024 | 12831125000 |
Data in motion
In the ever-evolving landscape of global technology, understanding the cost of revenue is crucial for evaluating a company's financial health. This analysis focuses on two industry giants: Telefonaktiebolaget LM Ericsson (publ) and Super Micro Computer, Inc., from 2014 to 2023.
Telefonaktiebolaget LM Ericsson (publ) has consistently maintained a high cost of revenue, peaking at approximately 161.7 billion in 2023, reflecting its expansive operations and market reach. In contrast, Super Micro Computer, Inc. has shown a remarkable growth trajectory, with its cost of revenue surging by over 900% from 2014 to 2023, reaching 12.8 billion. This growth underscores its aggressive market expansion and increasing production capabilities.
While Ericsson's data for 2024 is unavailable, the trend suggests continued stability. This analysis provides a snapshot of the financial strategies employed by these tech leaders, offering valuable insights for investors and industry analysts.
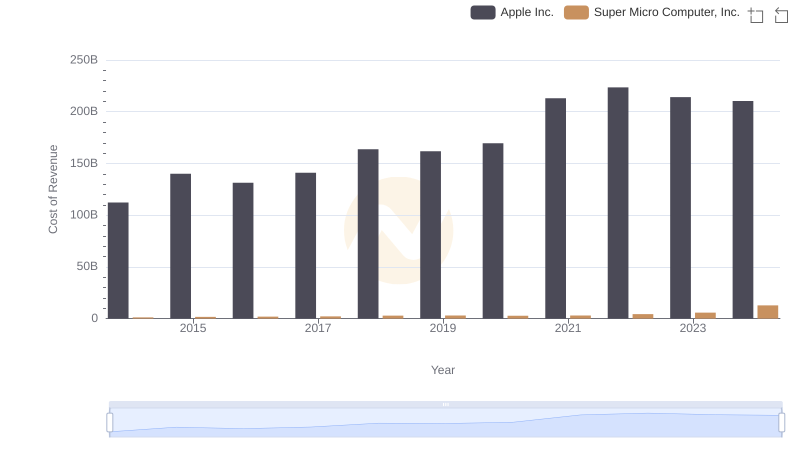
Apple Inc. vs Super Micro Computer, Inc.: Efficiency in Cost of Revenue Explored
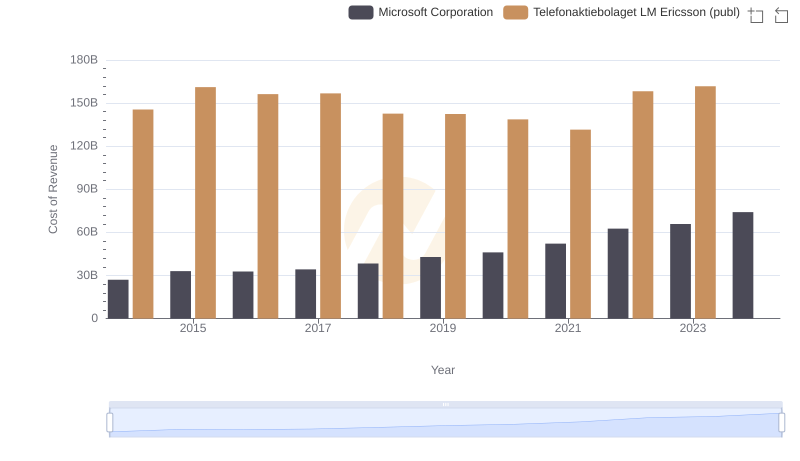
Cost Insights: Breaking Down Microsoft Corporation and Telefonaktiebolaget LM Ericsson (publ)'s Expenses
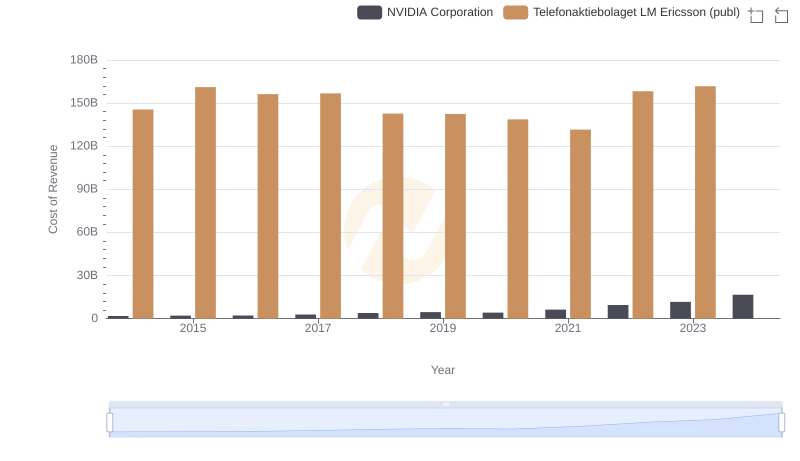
Cost of Revenue Trends: NVIDIA Corporation vs Telefonaktiebolaget LM Ericsson (publ)
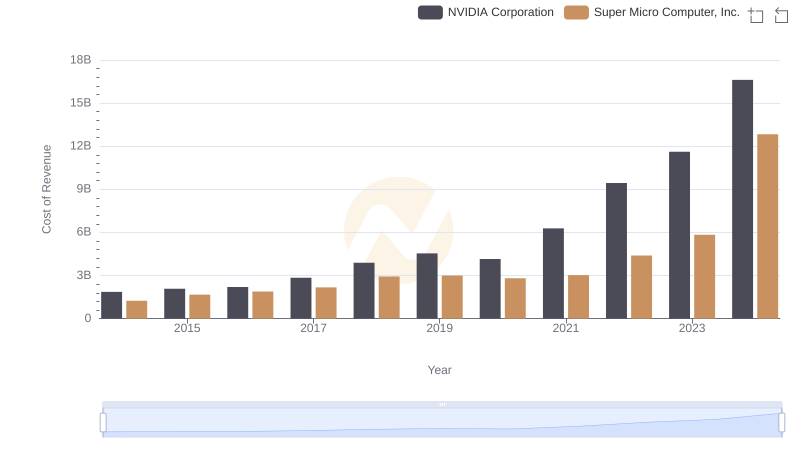
Cost of Revenue: Key Insights for NVIDIA Corporation and Super Micro Computer, Inc.
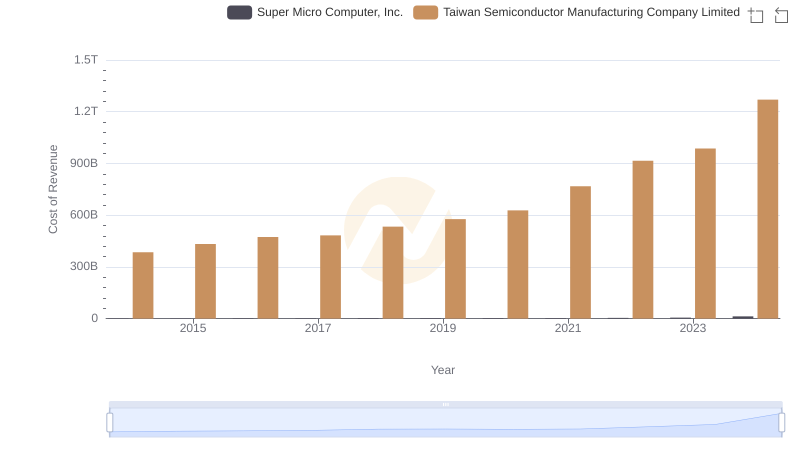
Cost Insights: Breaking Down Taiwan Semiconductor Manufacturing Company Limited and Super Micro Computer, Inc.'s Expenses
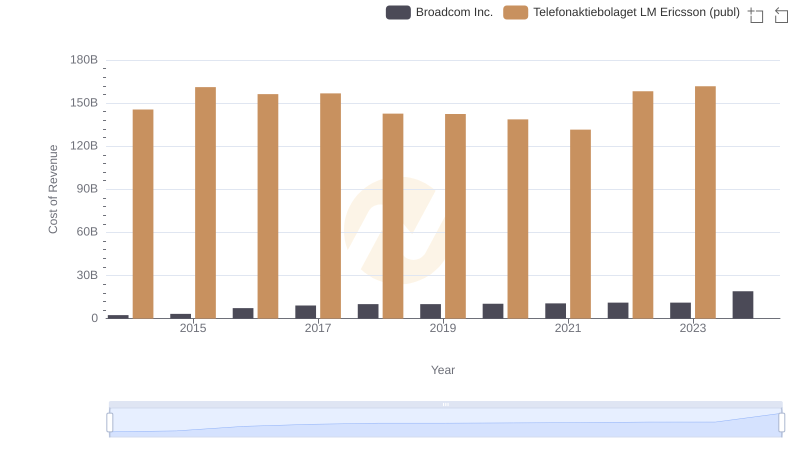
Cost of Revenue: Key Insights for Broadcom Inc. and Telefonaktiebolaget LM Ericsson (publ)
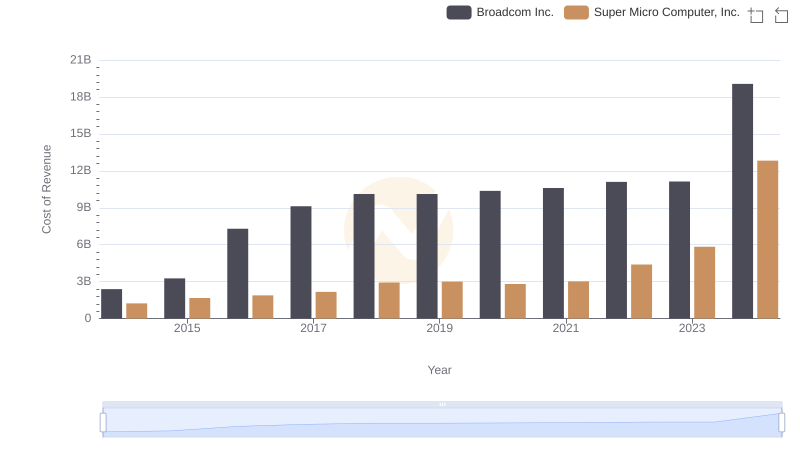
Cost of Revenue Comparison: Broadcom Inc. vs Super Micro Computer, Inc.
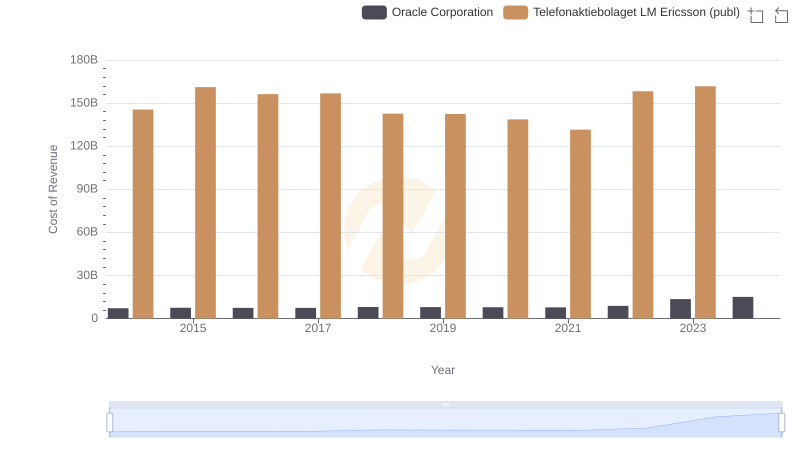
Cost of Revenue: Key Insights for Oracle Corporation and Telefonaktiebolaget LM Ericsson (publ)
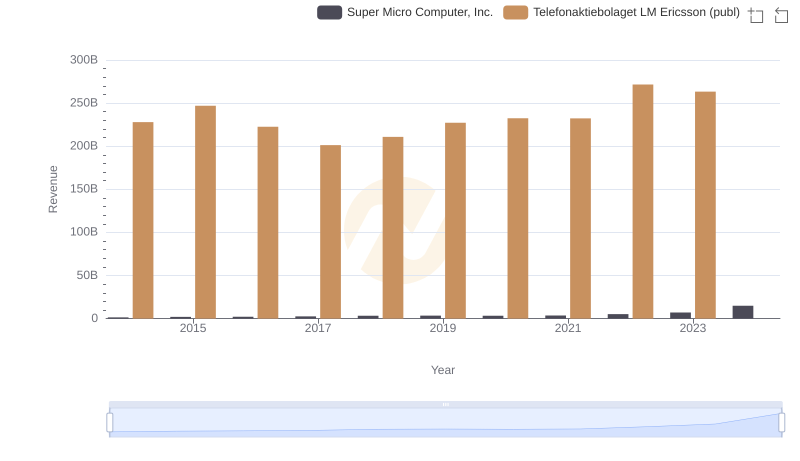
Annual Revenue Comparison: Telefonaktiebolaget LM Ericsson (publ) vs Super Micro Computer, Inc.
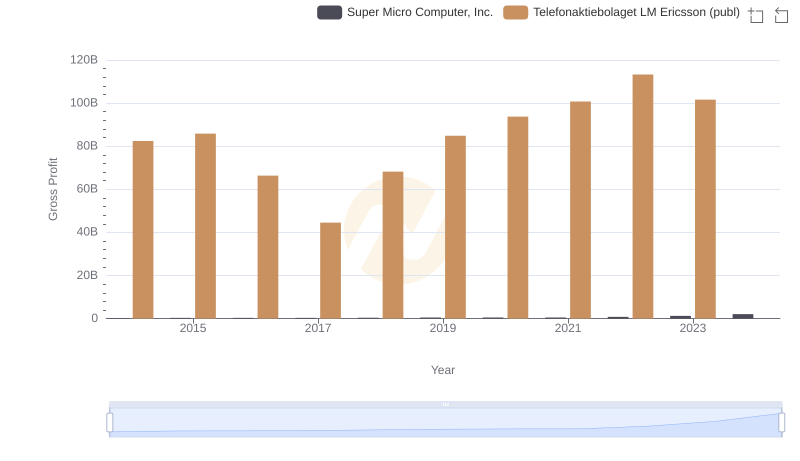
Gross Profit Trends Compared: Telefonaktiebolaget LM Ericsson (publ) vs Super Micro Computer, Inc.
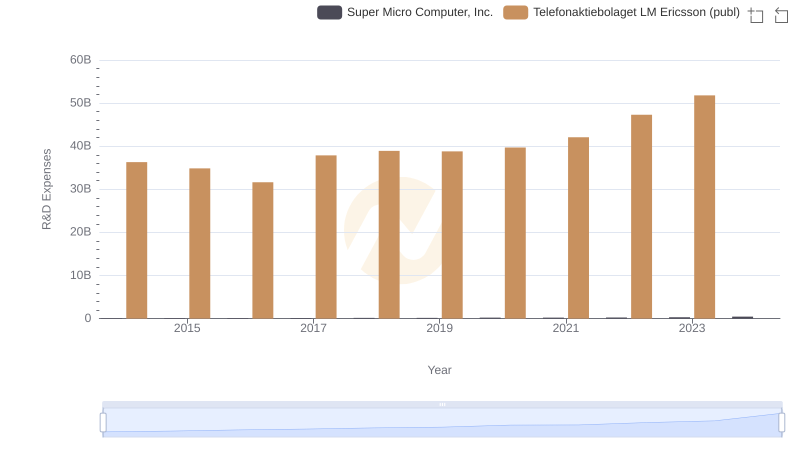
Research and Development Investment: Telefonaktiebolaget LM Ericsson (publ) vs Super Micro Computer, Inc.
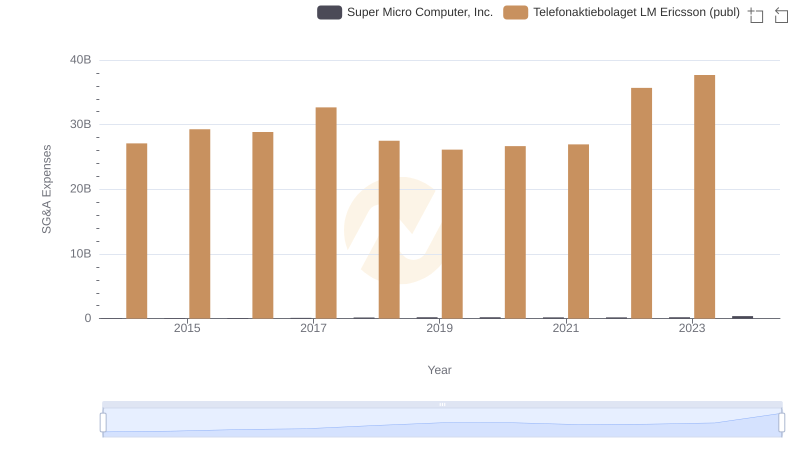
Operational Costs Compared: SG&A Analysis of Telefonaktiebolaget LM Ericsson (publ) and Super Micro Computer, Inc.