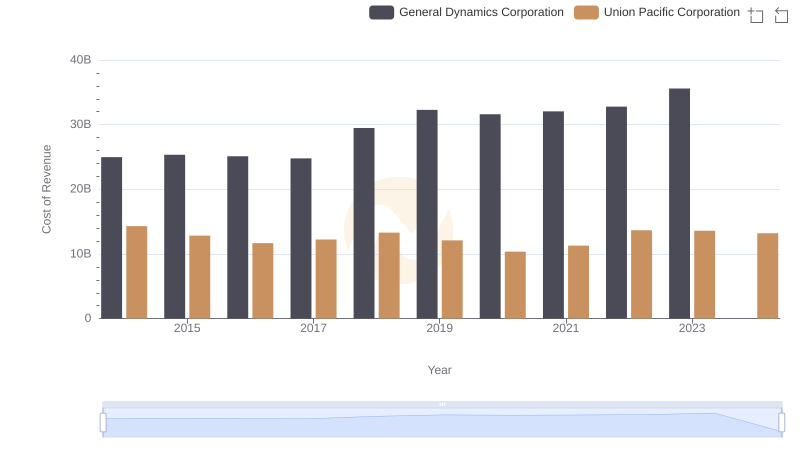
| __timestamp | General Dynamics Corporation | Union Pacific Corporation |
|---|---|---|
| Wednesday, January 1, 2014 | 30852000000 | 23988000000 |
| Thursday, January 1, 2015 | 31469000000 | 21813000000 |
| Friday, January 1, 2016 | 31353000000 | 19941000000 |
| Sunday, January 1, 2017 | 30973000000 | 21240000000 |
| Monday, January 1, 2018 | 36193000000 | 22832000000 |
| Tuesday, January 1, 2019 | 39350000000 | 21708000000 |
| Wednesday, January 1, 2020 | 37925000000 | 19533000000 |
| Friday, January 1, 2021 | 38469000000 | 21804000000 |
| Saturday, January 1, 2022 | 39407000000 | 24875000000 |
| Sunday, January 1, 2023 | 42272000000 | 24119000000 |
| Monday, January 1, 2024 | 47716000000 | 24250000000 |
Unleashing insights
In the ever-evolving landscape of American industry, two giants stand out: Union Pacific Corporation and General Dynamics Corporation. Over the past decade, these titans have showcased their prowess in revenue generation, with General Dynamics consistently leading the charge. From 2014 to 2024, General Dynamics has seen a remarkable 55% increase in revenue, peaking at an impressive $47.7 billion in 2024. In contrast, Union Pacific, while trailing, has demonstrated steady growth, achieving a 1% increase over the same period, reaching $24.3 billion in 2024.
This financial duel highlights the resilience and strategic acumen of both companies. General Dynamics, with its diversified portfolio in aerospace and defense, has capitalized on global demand, while Union Pacific, a stalwart in rail transportation, continues to navigate the challenges of a dynamic market. As we look to the future, these figures underscore the importance of innovation and adaptability in maintaining industry leadership.