| __timestamp | Gen Digital Inc. | Super Micro Computer, Inc. |
|---|---|---|
| Wednesday, January 1, 2014 | 1149000000 | 1241657000 |
| Thursday, January 1, 2015 | 1153000000 | 1670924000 |
| Friday, January 1, 2016 | 615000000 | 1884048000 |
| Sunday, January 1, 2017 | 853000000 | 2171349000 |
| Monday, January 1, 2018 | 1032000000 | 2930498000 |
| Tuesday, January 1, 2019 | 1050000000 | 3004838000 |
| Wednesday, January 1, 2020 | 393000000 | 2813071000 |
| Friday, January 1, 2021 | 362000000 | 3022884000 |
| Saturday, January 1, 2022 | 408000000 | 4396098000 |
| Sunday, January 1, 2023 | 589000000 | 5840470000 |
| Monday, January 1, 2024 | 731000000 | 12831125000 |
Data in motion
In the ever-evolving landscape of technology, understanding the cost of revenue is crucial for evaluating a company's financial health. This chart offers a fascinating comparison between Super Micro Computer, Inc. and Gen Digital Inc. over the past decade. From 2014 to 2024, Super Micro Computer, Inc. has consistently outpaced Gen Digital Inc. in cost of revenue, with a staggering 1,030% increase by 2024. In contrast, Gen Digital Inc. experienced a more modest 36% rise during the same period.
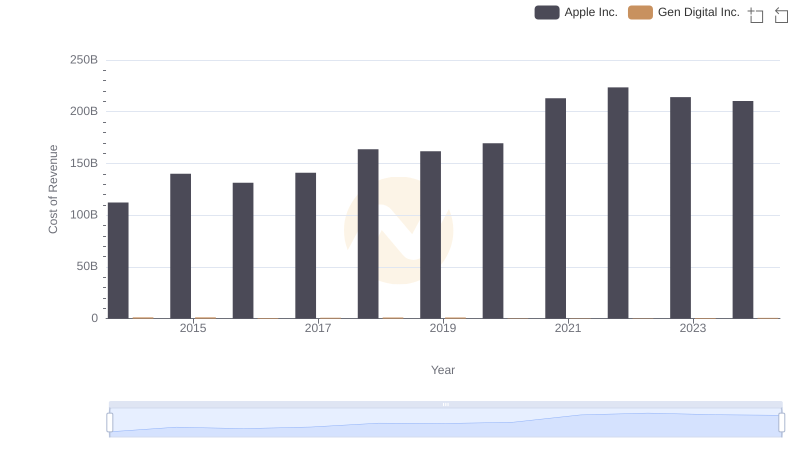
Analyzing Cost of Revenue: Apple Inc. and Gen Digital Inc.
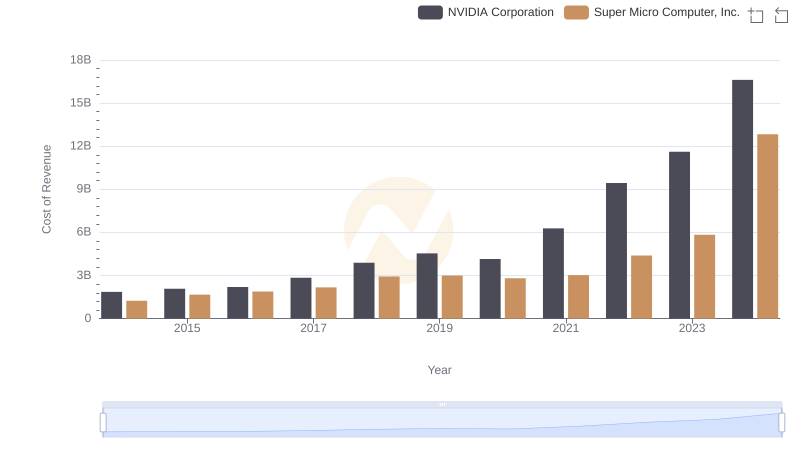
Cost of Revenue: Key Insights for NVIDIA Corporation and Super Micro Computer, Inc.
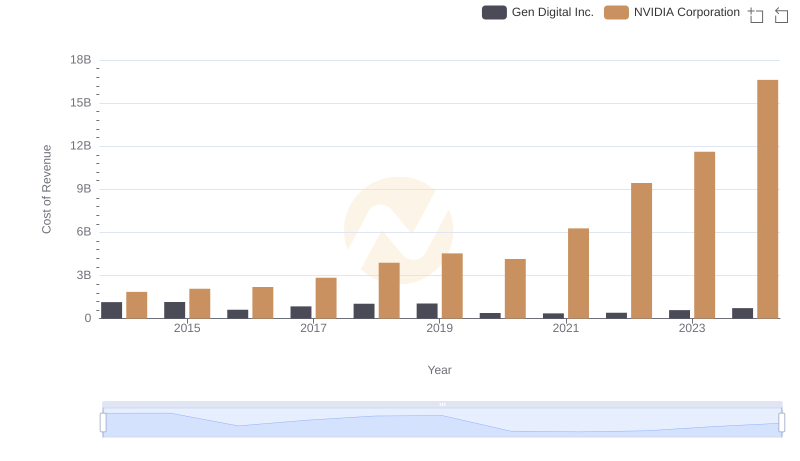
Cost Insights: Breaking Down NVIDIA Corporation and Gen Digital Inc.'s Expenses
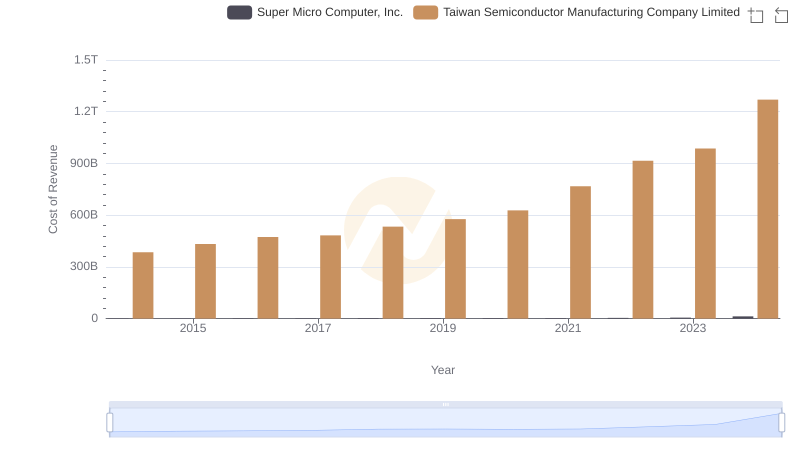
Cost Insights: Breaking Down Taiwan Semiconductor Manufacturing Company Limited and Super Micro Computer, Inc.'s Expenses
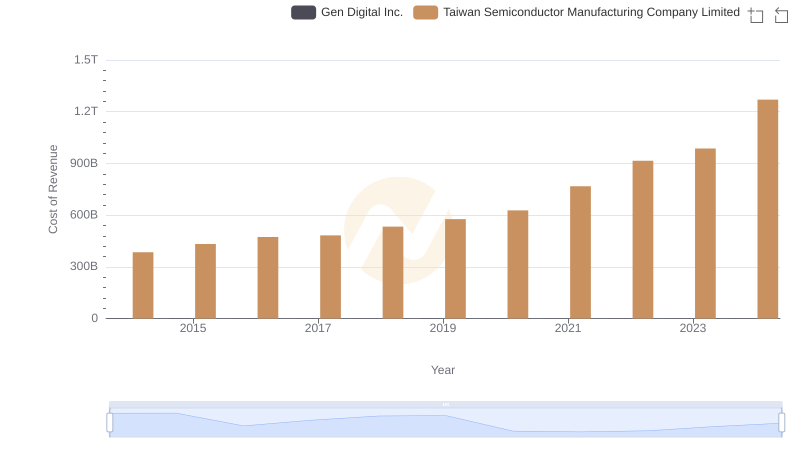
Cost of Revenue Trends: Taiwan Semiconductor Manufacturing Company Limited vs Gen Digital Inc.
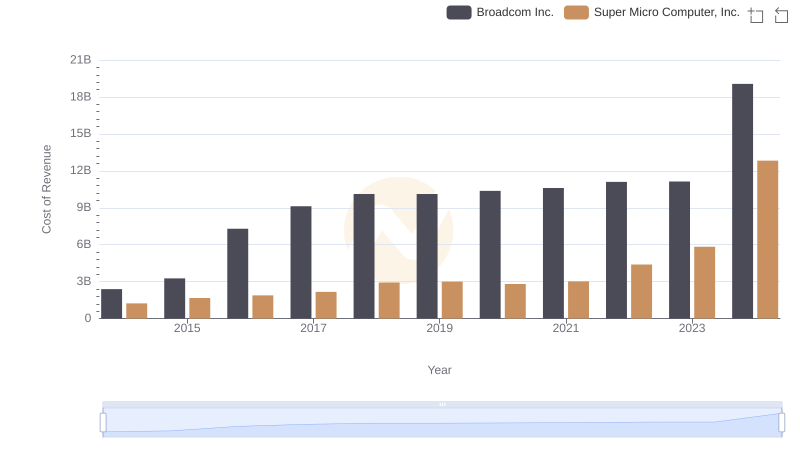
Cost of Revenue Comparison: Broadcom Inc. vs Super Micro Computer, Inc.
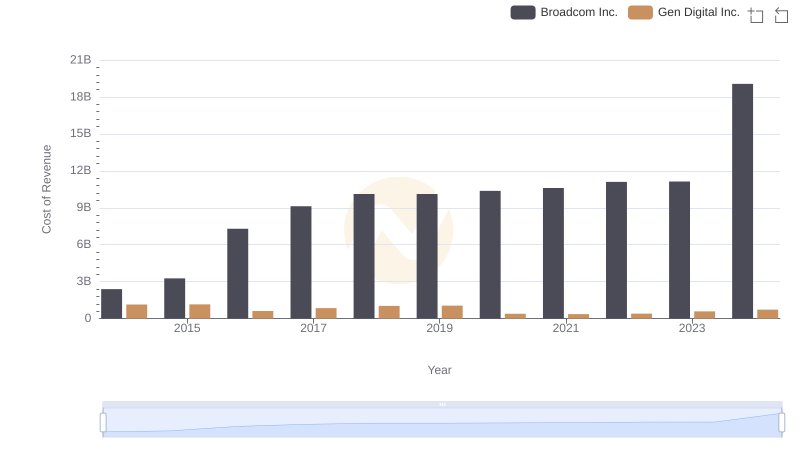
Comparing Cost of Revenue Efficiency: Broadcom Inc. vs Gen Digital Inc.
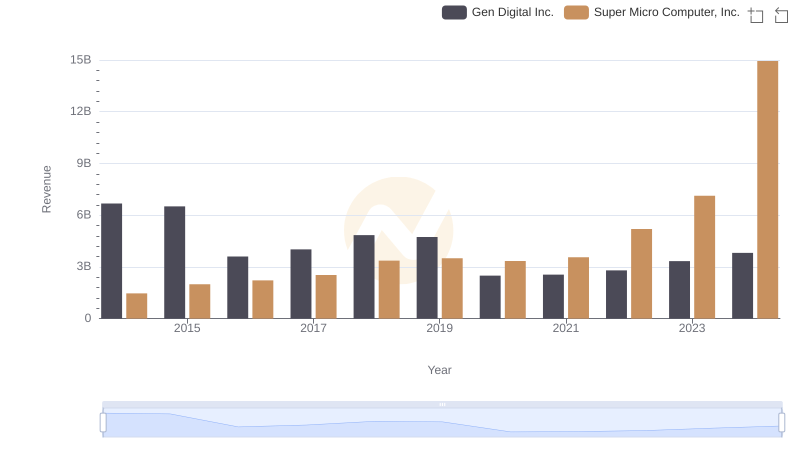
Breaking Down Revenue Trends: Super Micro Computer, Inc. vs Gen Digital Inc.
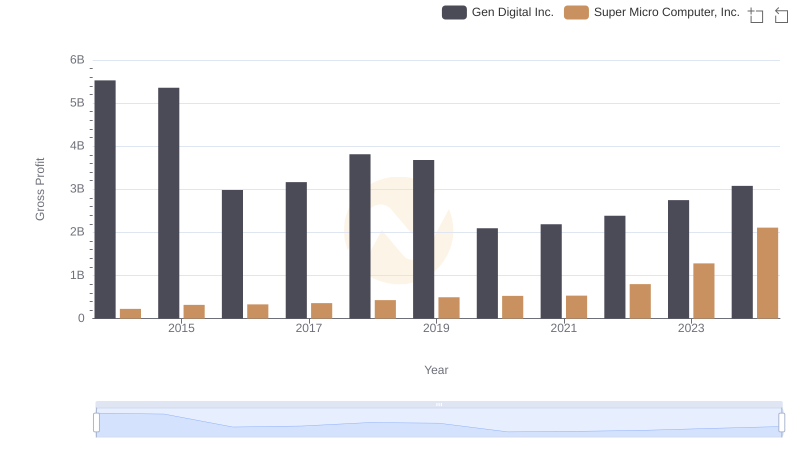
Gross Profit Trends Compared: Super Micro Computer, Inc. vs Gen Digital Inc.
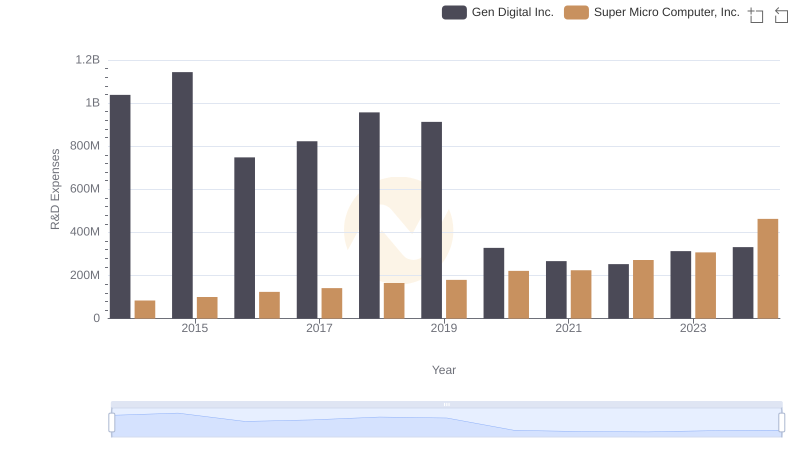
Research and Development: Comparing Key Metrics for Super Micro Computer, Inc. and Gen Digital Inc.
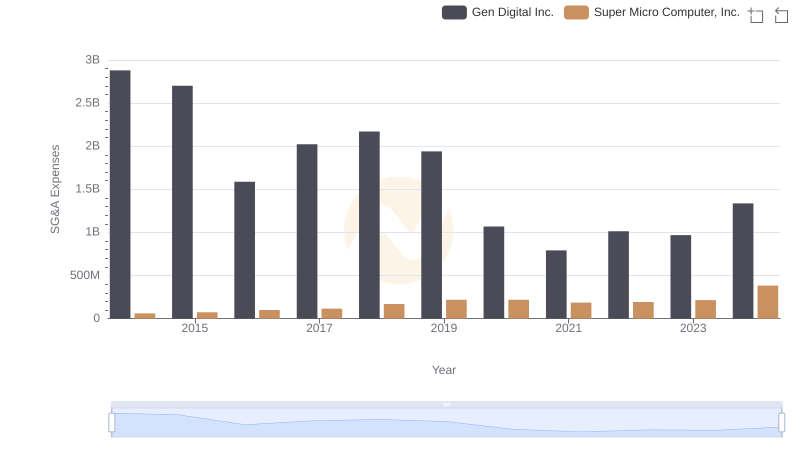
Super Micro Computer, Inc. or Gen Digital Inc.: Who Manages SG&A Costs Better?
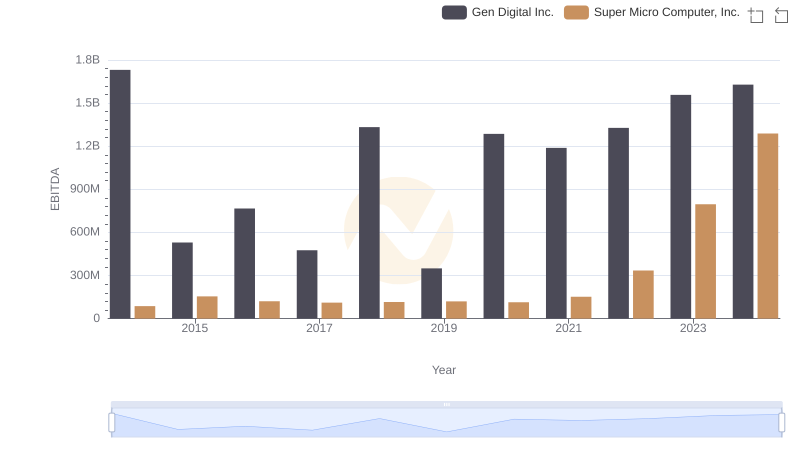
A Side-by-Side Analysis of EBITDA: Super Micro Computer, Inc. and Gen Digital Inc.