| __timestamp | Gen Digital Inc. | Super Micro Computer, Inc. |
|---|---|---|
| Wednesday, January 1, 2014 | 6676000000 | 1467202000 |
| Thursday, January 1, 2015 | 6508000000 | 1991155000 |
| Friday, January 1, 2016 | 3600000000 | 2215573000 |
| Sunday, January 1, 2017 | 4019000000 | 2529915000 |
| Monday, January 1, 2018 | 4846000000 | 3360492000 |
| Tuesday, January 1, 2019 | 4731000000 | 3500360000 |
| Wednesday, January 1, 2020 | 2490000000 | 3339281000 |
| Friday, January 1, 2021 | 2551000000 | 3557422000 |
| Saturday, January 1, 2022 | 2796000000 | 5196099000 |
| Sunday, January 1, 2023 | 3338000000 | 7123482000 |
| Monday, January 1, 2024 | 3812000000 | 14942854000 |
Data in motion
In the ever-evolving landscape of technology, revenue trends offer a window into the strategic maneuvers of industry leaders. This analysis juxtaposes the financial trajectories of Super Micro Computer, Inc. and Gen Digital Inc. over the past decade.
Super Micro Computer, Inc. has demonstrated a remarkable growth trajectory, with revenue surging by over 900% from 2014 to 2024. This growth is particularly pronounced in recent years, with a 40% increase from 2022 to 2023 alone, reaching a peak of approximately $14.9 billion in 2024.
Conversely, Gen Digital Inc. experienced a more volatile revenue pattern. After a peak in 2014, revenues dipped significantly, hitting a low in 2020. However, a steady recovery is evident, with a 53% increase from 2020 to 2024, culminating in revenues of around $3.8 billion.
These contrasting trends underscore the dynamic nature of the tech industry, where strategic pivots and market conditions shape financial outcomes.
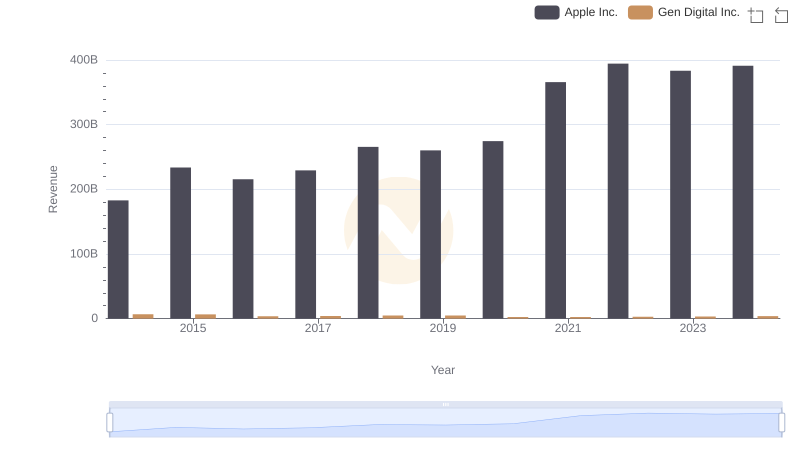
Apple Inc. or Gen Digital Inc.: Who Leads in Yearly Revenue?
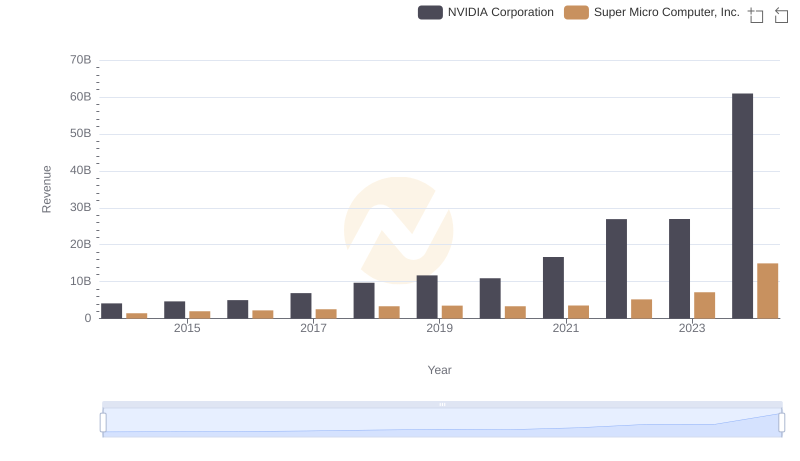
Who Generates More Revenue? NVIDIA Corporation or Super Micro Computer, Inc.
Comparing Revenue Performance: NVIDIA Corporation or Gen Digital Inc.?
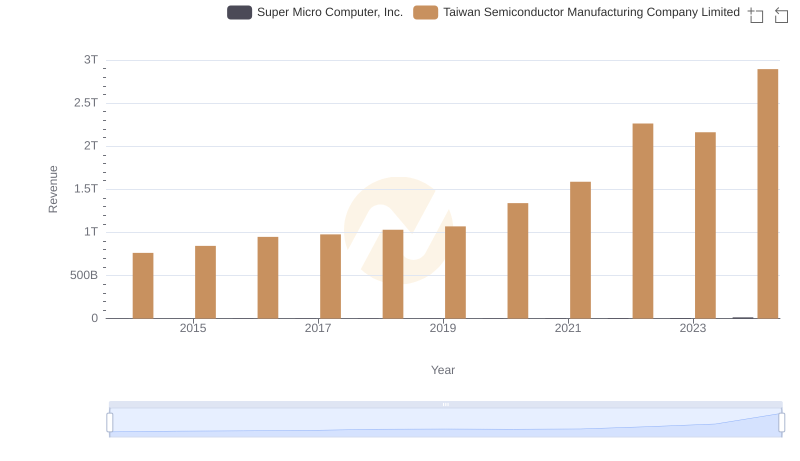
Revenue Insights: Taiwan Semiconductor Manufacturing Company Limited and Super Micro Computer, Inc. Performance Compared
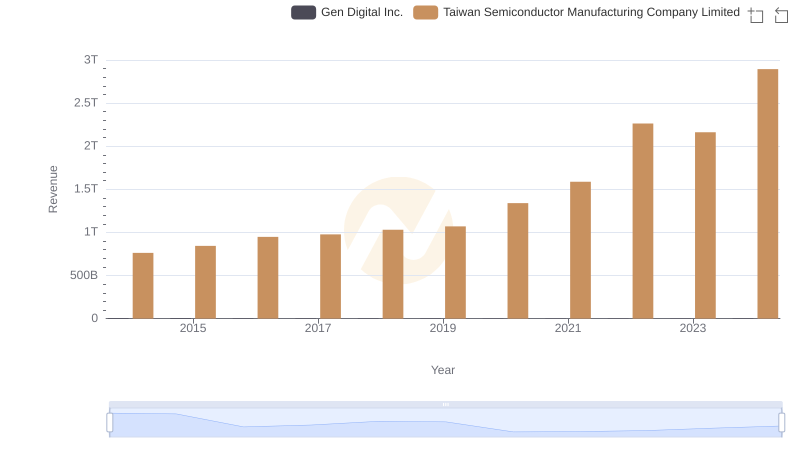
Revenue Showdown: Taiwan Semiconductor Manufacturing Company Limited vs Gen Digital Inc.
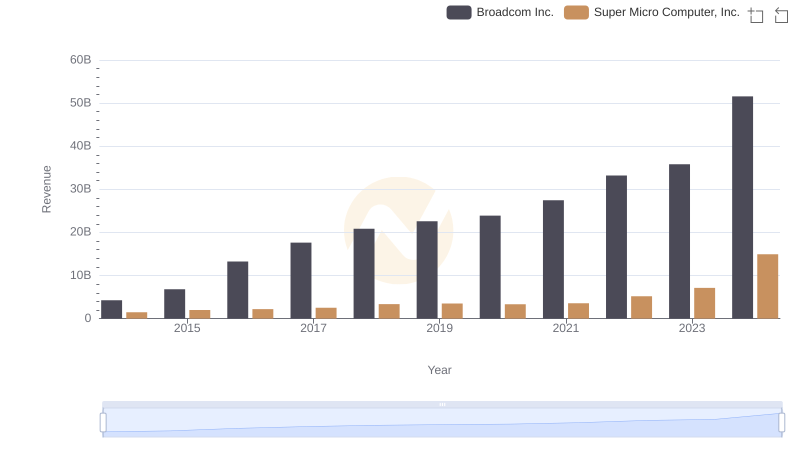
Broadcom Inc. vs Super Micro Computer, Inc.: Examining Key Revenue Metrics
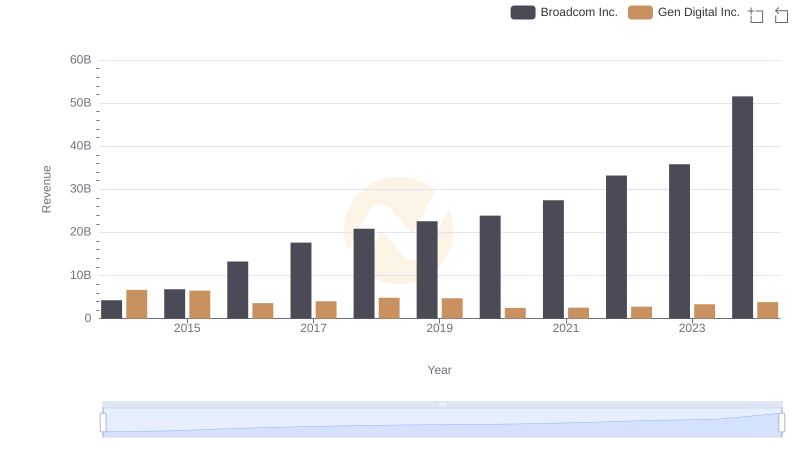
Broadcom Inc. vs Gen Digital Inc.: Examining Key Revenue Metrics
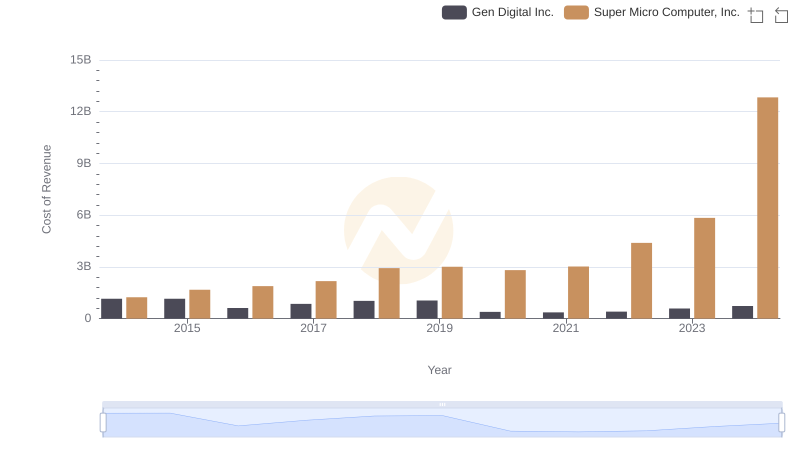
Cost of Revenue Comparison: Super Micro Computer, Inc. vs Gen Digital Inc.
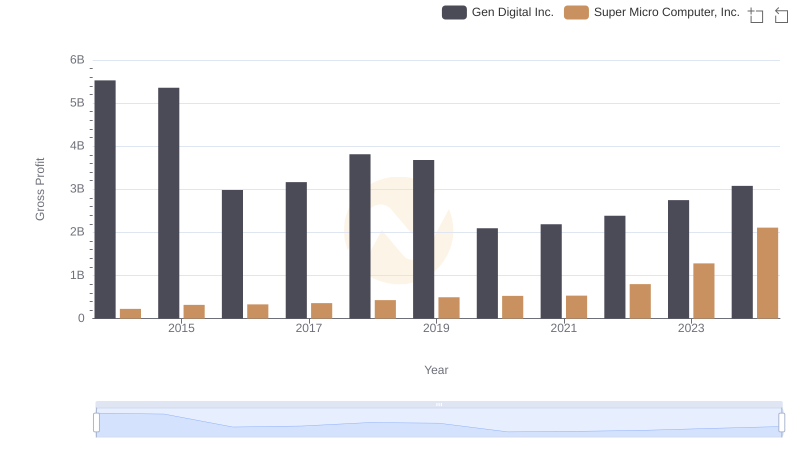
Gross Profit Trends Compared: Super Micro Computer, Inc. vs Gen Digital Inc.
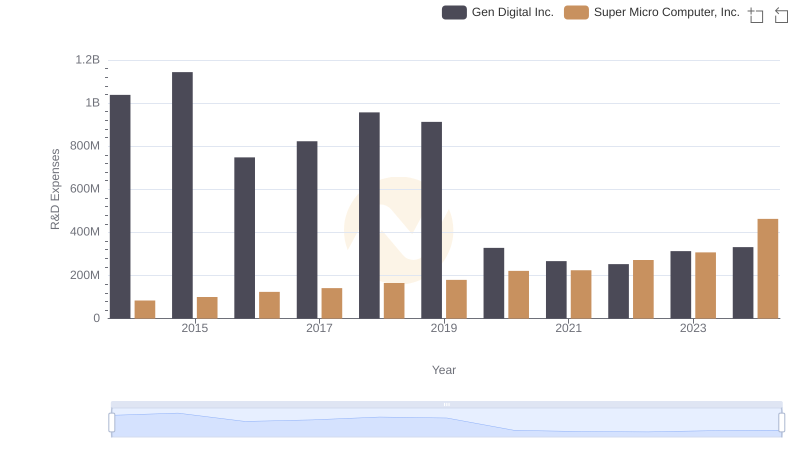
Research and Development: Comparing Key Metrics for Super Micro Computer, Inc. and Gen Digital Inc.
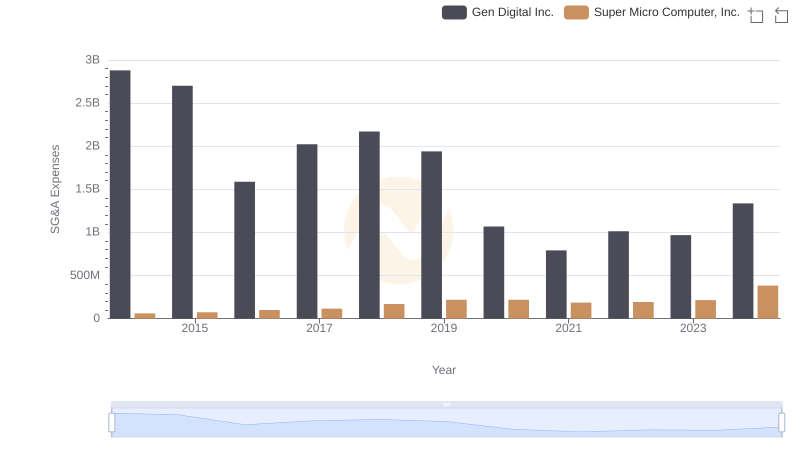
Super Micro Computer, Inc. or Gen Digital Inc.: Who Manages SG&A Costs Better?
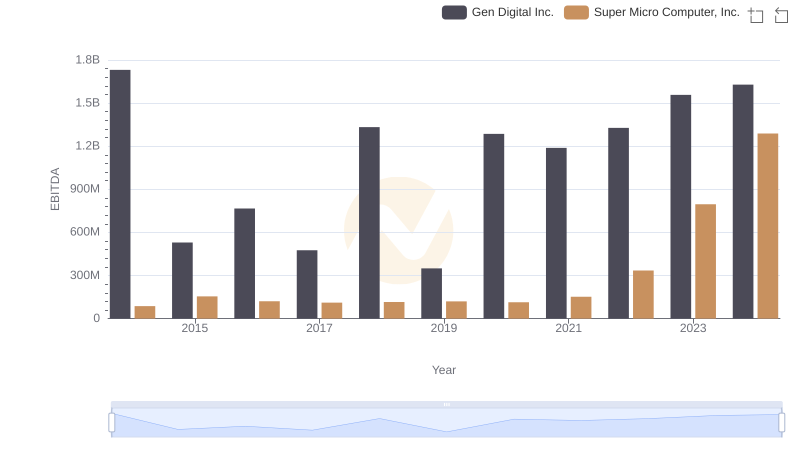
A Side-by-Side Analysis of EBITDA: Super Micro Computer, Inc. and Gen Digital Inc.