| __timestamp | Gen Digital Inc. | Super Micro Computer, Inc. |
|---|---|---|
| Wednesday, January 1, 2014 | 1731000000 | 86715000 |
| Thursday, January 1, 2015 | 530000000 | 154994000 |
| Friday, January 1, 2016 | 766000000 | 120773000 |
| Sunday, January 1, 2017 | 476000000 | 111232000 |
| Monday, January 1, 2018 | 1333000000 | 115787000 |
| Tuesday, January 1, 2019 | 350000000 | 120415000 |
| Wednesday, January 1, 2020 | 1286000000 | 114126000 |
| Friday, January 1, 2021 | 1188000000 | 152132000 |
| Saturday, January 1, 2022 | 1328000000 | 335167000 |
| Sunday, January 1, 2023 | 1557000000 | 796046000 |
| Monday, January 1, 2024 | 1629000000 | 1288409000 |
Cracking the code
In the ever-evolving landscape of technology, financial performance is a key indicator of a company's resilience and growth. Over the past decade, from 2014 to 2024, Super Micro Computer, Inc. and Gen Digital Inc. have showcased contrasting EBITDA trajectories. Gen Digital Inc. started strong in 2014, with an EBITDA nearly 20 times that of Super Micro Computer, Inc. However, by 2024, Super Micro Computer, Inc. has closed the gap significantly, achieving an impressive 1,385% growth in EBITDA. This remarkable turnaround highlights Super Micro's strategic advancements and market adaptability. Meanwhile, Gen Digital Inc. maintained a steady growth, peaking in 2024 with a 6% increase from the previous year. This side-by-side analysis not only underscores the dynamic nature of the tech industry but also serves as a testament to the strategic prowess of these two giants.
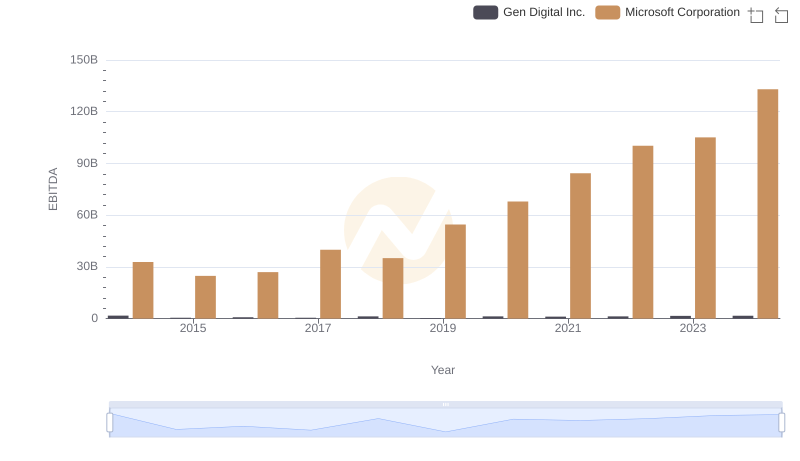
A Professional Review of EBITDA: Microsoft Corporation Compared to Gen Digital Inc.
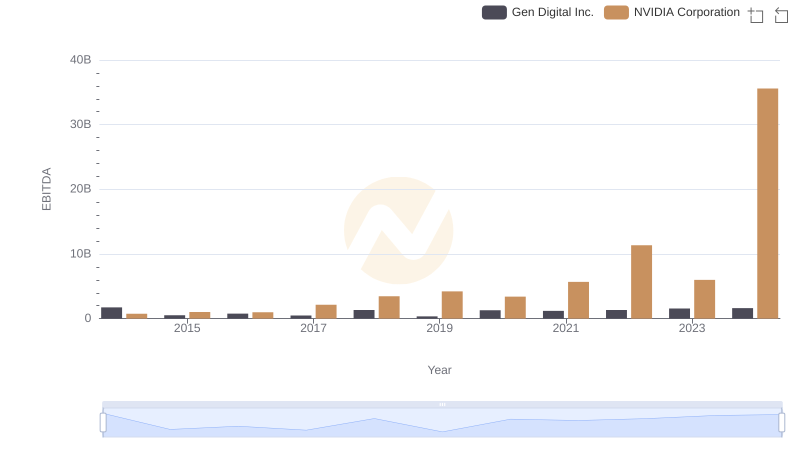
Comprehensive EBITDA Comparison: NVIDIA Corporation vs Gen Digital Inc.
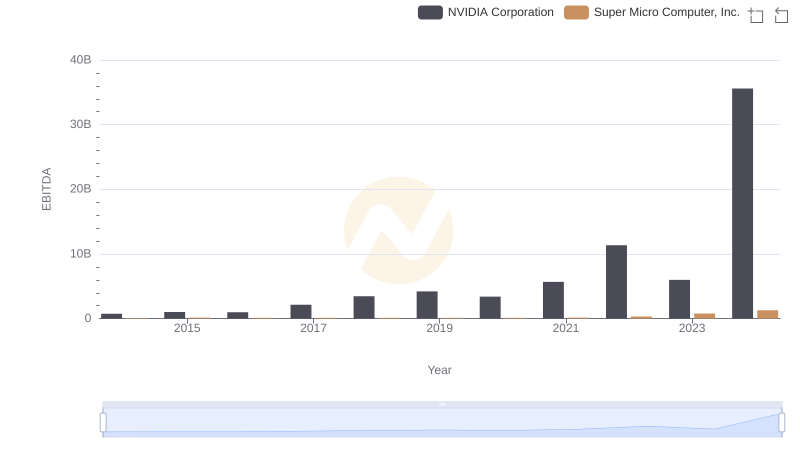
A Professional Review of EBITDA: NVIDIA Corporation Compared to Super Micro Computer, Inc.
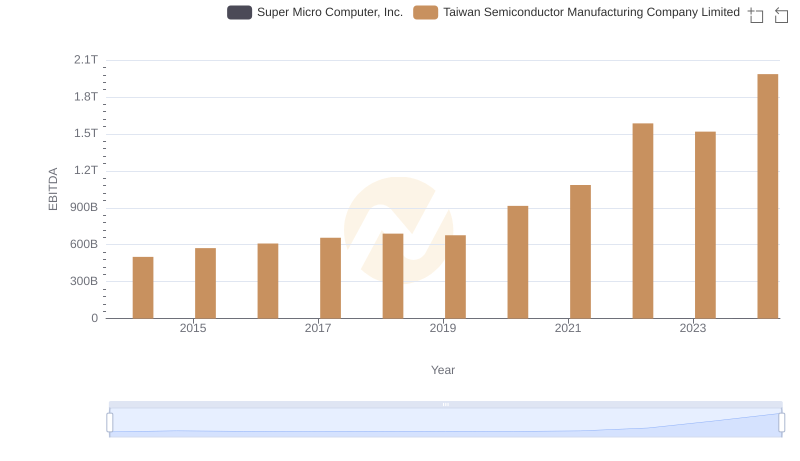
EBITDA Performance Review: Taiwan Semiconductor Manufacturing Company Limited vs Super Micro Computer, Inc.
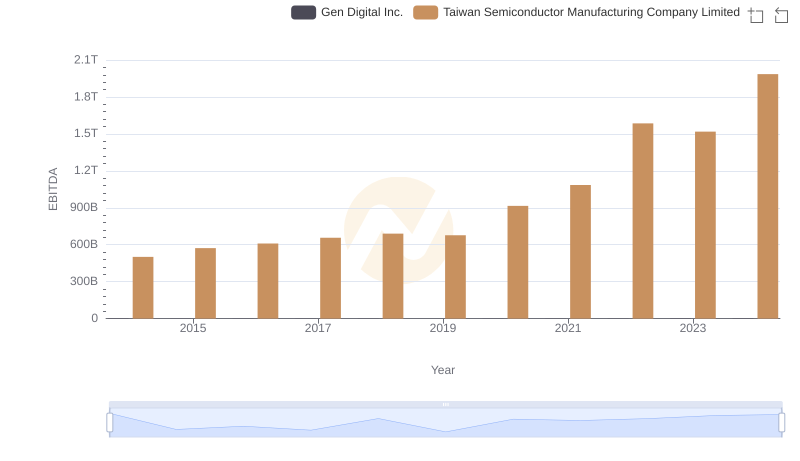
Professional EBITDA Benchmarking: Taiwan Semiconductor Manufacturing Company Limited vs Gen Digital Inc.
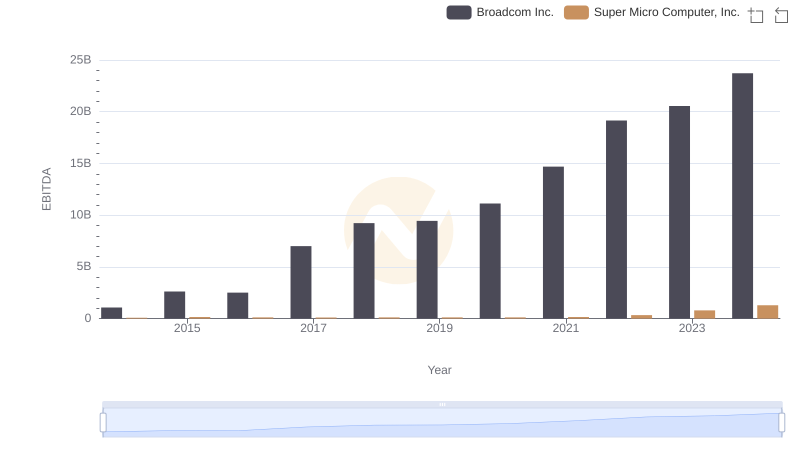
A Side-by-Side Analysis of EBITDA: Broadcom Inc. and Super Micro Computer, Inc.
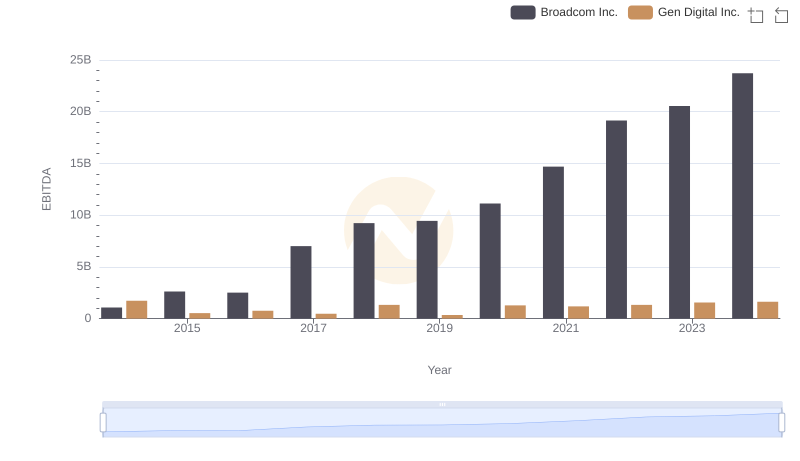
EBITDA Analysis: Evaluating Broadcom Inc. Against Gen Digital Inc.
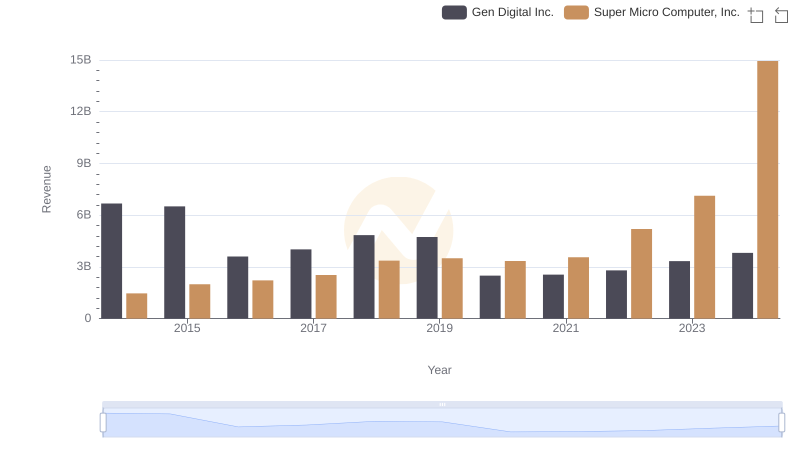
Breaking Down Revenue Trends: Super Micro Computer, Inc. vs Gen Digital Inc.
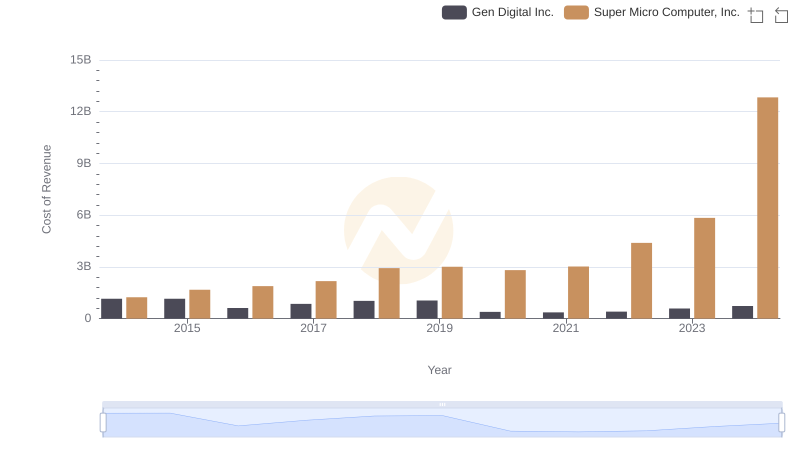
Cost of Revenue Comparison: Super Micro Computer, Inc. vs Gen Digital Inc.
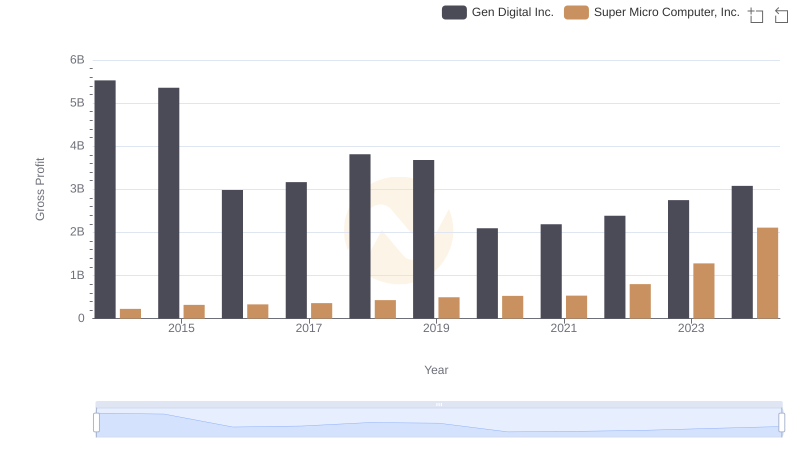
Gross Profit Trends Compared: Super Micro Computer, Inc. vs Gen Digital Inc.
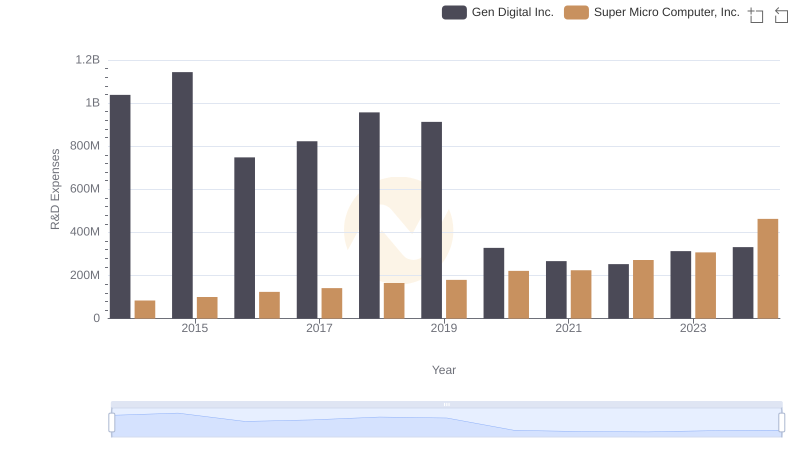
Research and Development: Comparing Key Metrics for Super Micro Computer, Inc. and Gen Digital Inc.
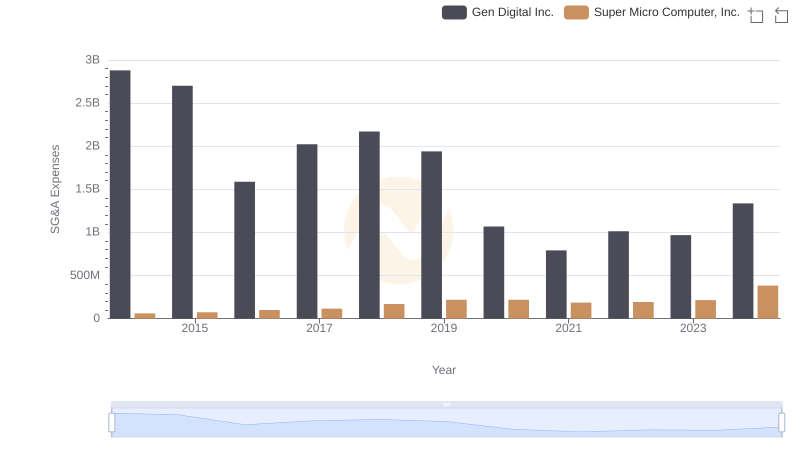
Super Micro Computer, Inc. or Gen Digital Inc.: Who Manages SG&A Costs Better?