| __timestamp | CSX Corporation | Masco Corporation |
|---|---|---|
| Wednesday, January 1, 2014 | 4740000000 | 899000000 |
| Thursday, January 1, 2015 | 4890000000 | 1041000000 |
| Friday, January 1, 2016 | 4640000000 | 1220000000 |
| Sunday, January 1, 2017 | 5113000000 | 1314000000 |
| Monday, January 1, 2018 | 6274000000 | 1240000000 |
| Tuesday, January 1, 2019 | 6402000000 | 1244000000 |
| Wednesday, January 1, 2020 | 5764000000 | 1410000000 |
| Friday, January 1, 2021 | 6653000000 | 1185000000 |
| Saturday, January 1, 2022 | 7390000000 | 1490000000 |
| Sunday, January 1, 2023 | 7340000000 | 1493000000 |
| Monday, January 1, 2024 | 1410000000 |
Unleashing the power of data
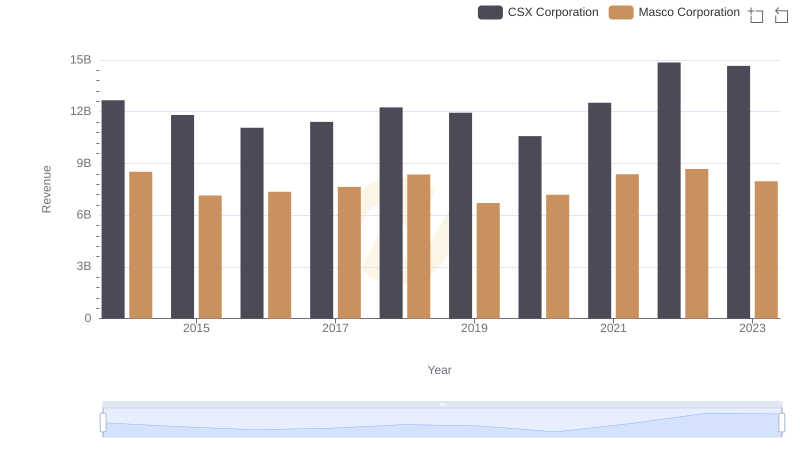
In the ever-evolving landscape of American industry, the financial health of companies is often gauged by their EBITDA, a key indicator of operational performance. Over the past decade, CSX Corporation and Masco Corporation have showcased contrasting trajectories in their EBITDA growth.
From 2014 to 2023, CSX Corporation's EBITDA surged by approximately 55%, reflecting its robust operational strategies and market adaptability. In contrast, Masco Corporation experienced a more modest growth of around 66%, indicating steady yet less aggressive expansion. Notably, CSX's EBITDA peaked in 2022, reaching nearly 7.4 billion, while Masco's highest was in 2023, at about 1.5 billion.
This comparison highlights the dynamic nature of these industries, with CSX's transportation prowess and Masco's home improvement focus each carving unique paths. As we look to the future, these trends offer valuable insights into the strategic directions of these corporate giants.