| __timestamp | Caterpillar Inc. | FedEx Corporation |
|---|---|---|
| Wednesday, January 1, 2014 | 14793000000 | 9373000000 |
| Thursday, January 1, 2015 | 12878000000 | 8558000000 |
| Friday, January 1, 2016 | 9632000000 | 10328000000 |
| Sunday, January 1, 2017 | 13767000000 | 13808000000 |
| Monday, January 1, 2018 | 17003000000 | 14700000000 |
| Tuesday, January 1, 2019 | 16416000000 | 14827000000 |
| Wednesday, January 1, 2020 | 12077000000 | 13344000000 |
| Friday, January 1, 2021 | 15003000000 | 17954000000 |
| Saturday, January 1, 2022 | 17512000000 | 20167000000 |
| Sunday, January 1, 2023 | 23263000000 | 19166000000 |
| Monday, January 1, 2024 | 23324000000 | 18952000000 |
Unleashing insights
In the ever-evolving landscape of global business, understanding the financial health of industry giants like Caterpillar Inc. and FedEx Corporation is crucial. Over the past decade, these two titans have showcased intriguing trends in their gross profit margins. From 2014 to 2023, Caterpillar Inc. experienced a remarkable 57% increase in gross profit, peaking in 2023. This growth reflects its strategic innovations and market adaptability. Meanwhile, FedEx Corporation saw a steady rise, with a notable 48% increase from 2014 to 2022, before a slight dip in 2023. This fluctuation highlights the challenges faced in the logistics sector, especially in a post-pandemic world. Interestingly, 2024 data for Caterpillar is missing, leaving room for speculation on its future trajectory. As these companies navigate economic shifts, their financial performance offers valuable insights into their resilience and strategic foresight.
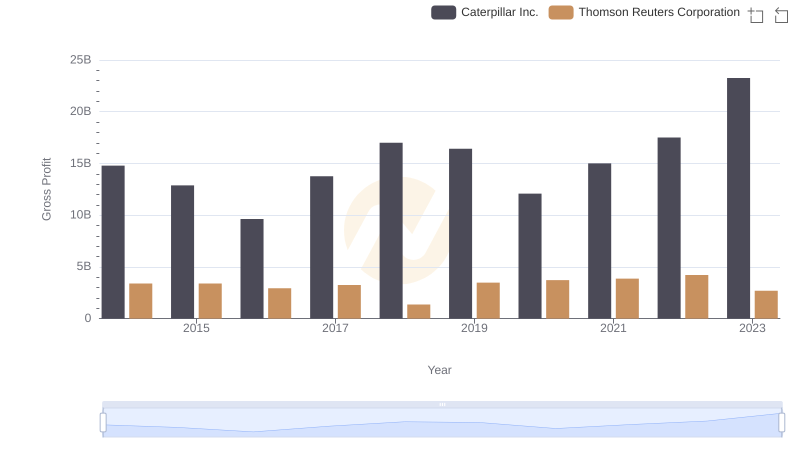
Caterpillar Inc. vs Thomson Reuters Corporation: A Gross Profit Performance Breakdown
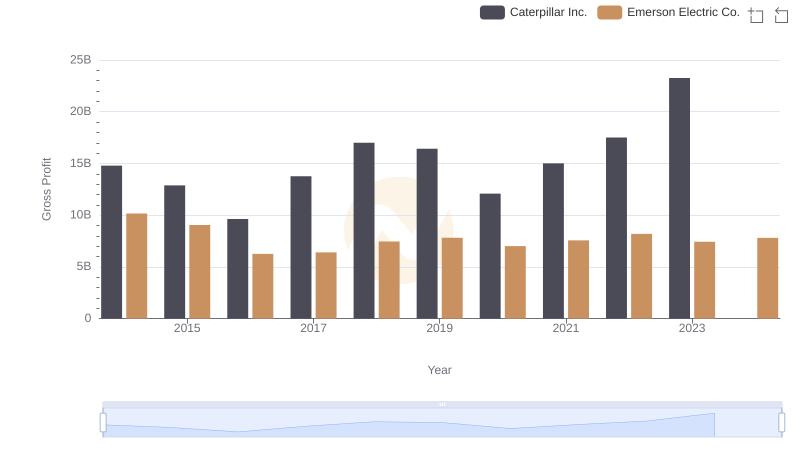
Caterpillar Inc. vs Emerson Electric Co.: A Gross Profit Performance Breakdown
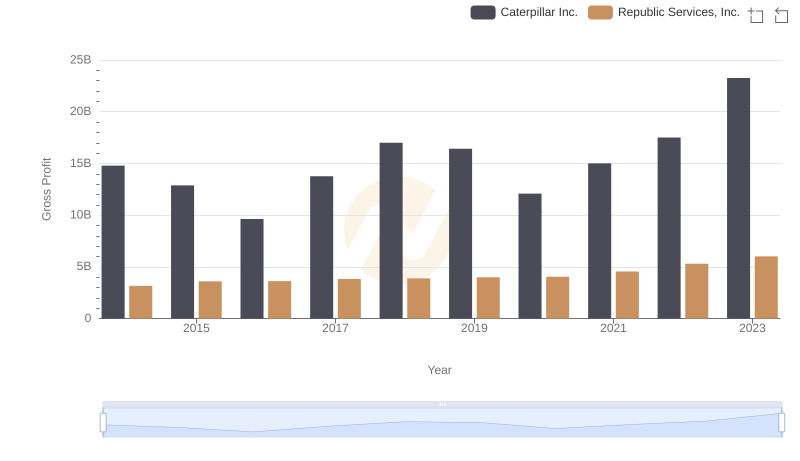
Caterpillar Inc. and Republic Services, Inc.: A Detailed Gross Profit Analysis
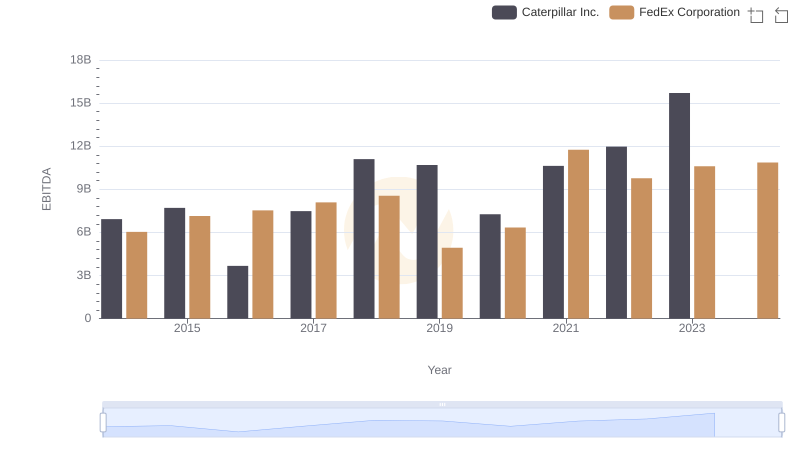
Comprehensive EBITDA Comparison: Caterpillar Inc. vs FedEx Corporation