| __timestamp | Caterpillar Inc. | Emerson Electric Co. |
|---|---|---|
| Wednesday, January 1, 2014 | 14793000000 | 10158000000 |
| Thursday, January 1, 2015 | 12878000000 | 9048000000 |
| Friday, January 1, 2016 | 9632000000 | 6262000000 |
| Sunday, January 1, 2017 | 13767000000 | 6404000000 |
| Monday, January 1, 2018 | 17003000000 | 7460000000 |
| Tuesday, January 1, 2019 | 16416000000 | 7815000000 |
| Wednesday, January 1, 2020 | 12077000000 | 7009000000 |
| Friday, January 1, 2021 | 15003000000 | 7563000000 |
| Saturday, January 1, 2022 | 17512000000 | 8188000000 |
| Sunday, January 1, 2023 | 23263000000 | 7427000000 |
| Monday, January 1, 2024 | 23324000000 | 7808000000 |
Unveiling the hidden dimensions of data
In the ever-evolving landscape of industrial giants, Caterpillar Inc. and Emerson Electric Co. have been pivotal players. Over the past decade, from 2014 to 2023, these companies have showcased contrasting trajectories in their gross profit performance. Caterpillar Inc. has demonstrated a robust growth pattern, with its gross profit peaking at an impressive 132% increase by 2023 compared to its lowest point in 2016. In contrast, Emerson Electric Co. has experienced a more fluctuating journey, with its gross profit peaking in 2014 and then stabilizing around 77% of that peak in recent years.
The data reveals a compelling narrative of resilience and adaptation, particularly for Caterpillar Inc., which has consistently outperformed Emerson Electric Co. in terms of gross profit. As we look to the future, the missing data for 2024 leaves room for speculation and anticipation.
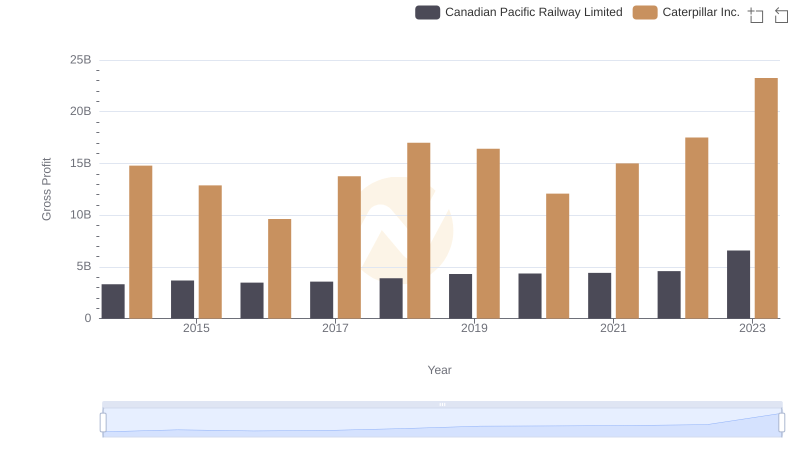
Gross Profit Comparison: Caterpillar Inc. and Canadian Pacific Railway Limited Trends
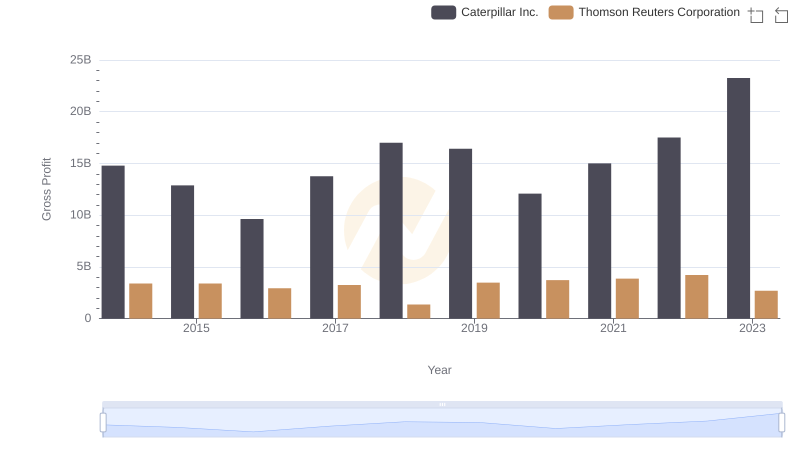
Caterpillar Inc. vs Thomson Reuters Corporation: A Gross Profit Performance Breakdown
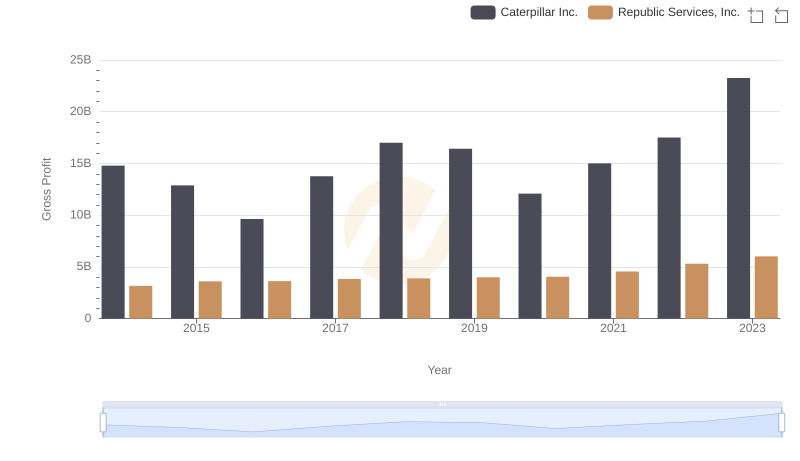
Caterpillar Inc. and Republic Services, Inc.: A Detailed Gross Profit Analysis
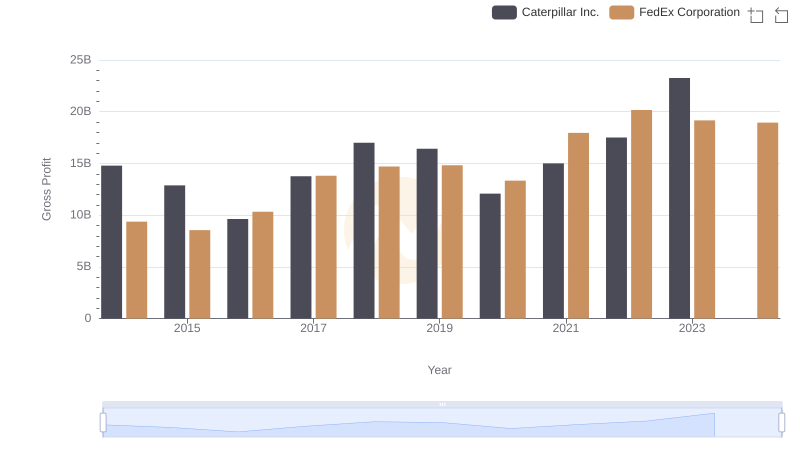
Caterpillar Inc. and FedEx Corporation: A Detailed Gross Profit Analysis