| __timestamp | Canadian National Railway Company | Ferrovial SE |
|---|---|---|
| Wednesday, January 1, 2014 | 4992000000 | 7671000000 |
| Thursday, January 1, 2015 | 5660000000 | 8556000000 |
| Friday, January 1, 2016 | 5675000000 | 9491000000 |
| Sunday, January 1, 2017 | 5675000000 | 10864000000 |
| Monday, January 1, 2018 | 5962000000 | 4752000000 |
| Tuesday, January 1, 2019 | 6085000000 | 5105000000 |
| Wednesday, January 1, 2020 | 5771000000 | 5336000000 |
| Friday, January 1, 2021 | 6069000000 | 5701000000 |
| Saturday, January 1, 2022 | 7396000000 | 6354000000 |
| Sunday, January 1, 2023 | 7151000000 | 7385000000 |
Unleashing insights
In the world of transportation and infrastructure, Canadian National Railway Company and Ferrovial SE stand as titans. Over the past decade, these companies have showcased their prowess in gross profit performance, with intriguing trends emerging from 2014 to 2023. Canadian National Railway, a leader in North American rail transport, saw its gross profit grow by approximately 43% from 2014 to 2023. Meanwhile, Ferrovial SE, a Spanish multinational known for its infrastructure projects, experienced a more volatile journey, with a notable dip in 2018 but a strong recovery by 2023.
Despite the fluctuations, both companies have demonstrated resilience and adaptability in a competitive market. The data reveals that while Canadian National Railway maintained a steady upward trajectory, Ferrovial SE's performance was more erratic, yet ultimately converging with its competitor by 2023. This analysis offers a fascinating glimpse into the strategic maneuvers of these industry leaders.
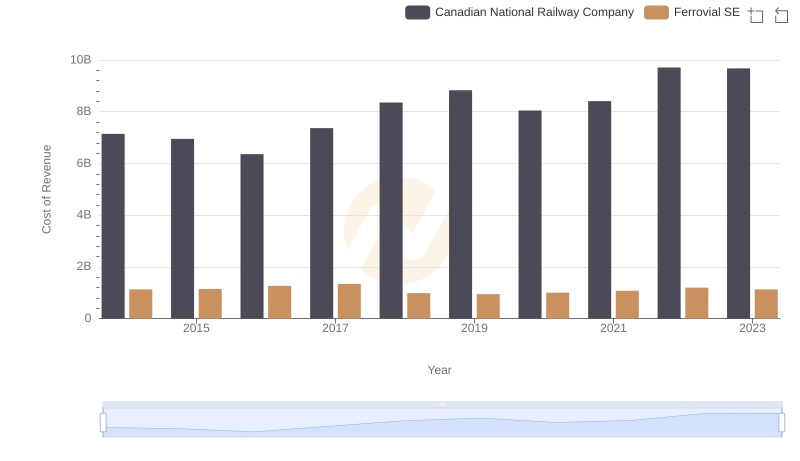
Cost Insights: Breaking Down Canadian National Railway Company and Ferrovial SE's Expenses
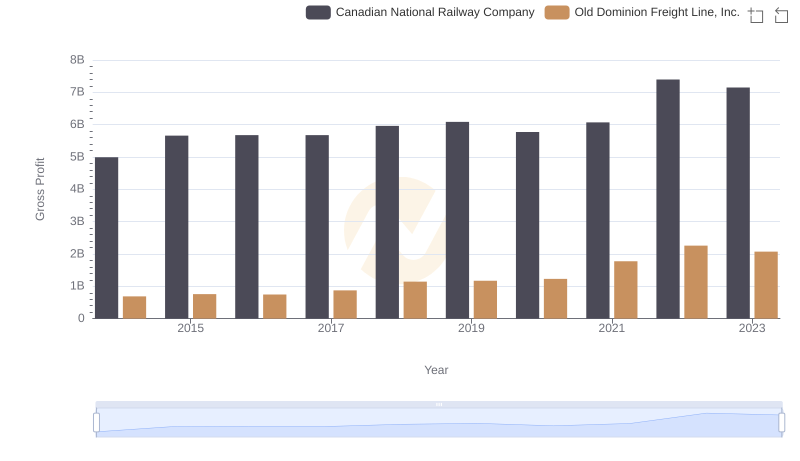
Key Insights on Gross Profit: Canadian National Railway Company vs Old Dominion Freight Line, Inc.
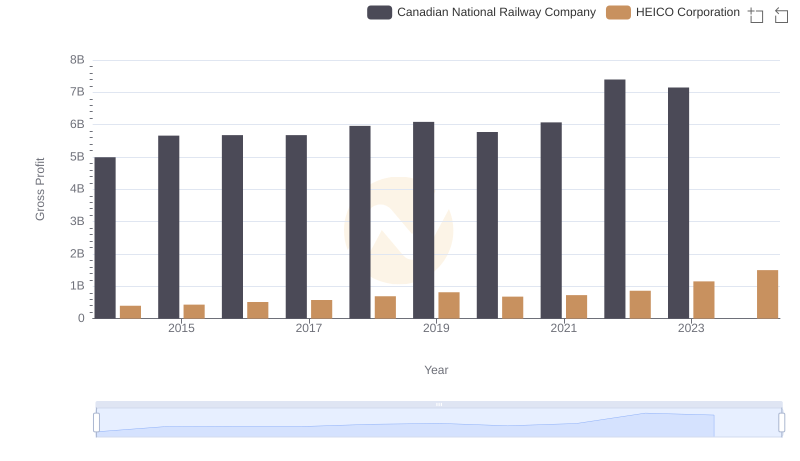
Gross Profit Comparison: Canadian National Railway Company and HEICO Corporation Trends
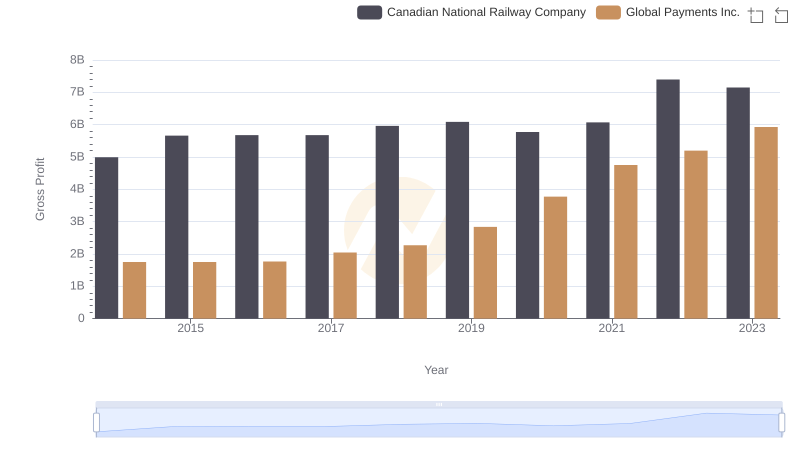
Gross Profit Trends Compared: Canadian National Railway Company vs Global Payments Inc.