| __timestamp | Canadian National Railway Company | Ferrovial SE |
|---|---|---|
| Wednesday, January 1, 2014 | 7142000000 | 1131000000 |
| Thursday, January 1, 2015 | 6951000000 | 1143000000 |
| Friday, January 1, 2016 | 6362000000 | 1267000000 |
| Sunday, January 1, 2017 | 7366000000 | 1345000000 |
| Monday, January 1, 2018 | 8359000000 | 985000000 |
| Tuesday, January 1, 2019 | 8832000000 | 949000000 |
| Wednesday, January 1, 2020 | 8048000000 | 1005000000 |
| Friday, January 1, 2021 | 8408000000 | 1077000000 |
| Saturday, January 1, 2022 | 9711000000 | 1197000000 |
| Sunday, January 1, 2023 | 9677000000 | 1129000000 |
Cracking the code
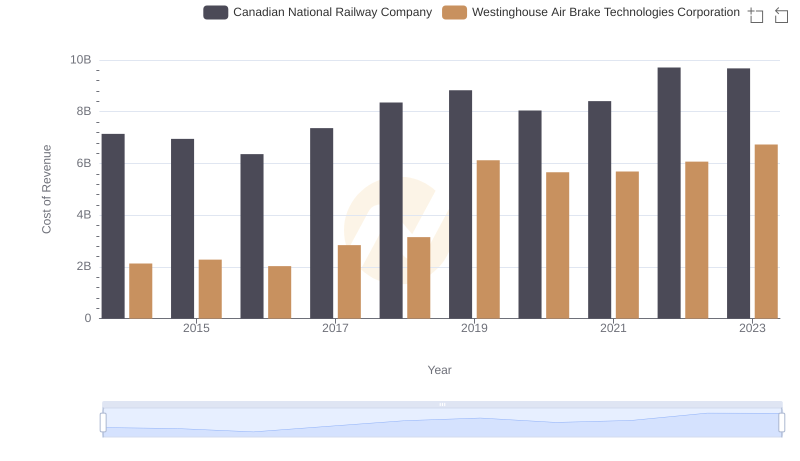
In the ever-evolving landscape of global transportation, understanding cost structures is crucial. This analysis delves into the cost of revenue trends for two industry giants: Canadian National Railway Company (CNR) and Ferrovial SE, from 2014 to 2023. Over this period, CNR's cost of revenue has shown a steady increase, peaking in 2022 with a 52% rise from its 2016 low. In contrast, Ferrovial SE's expenses have remained relatively stable, with minor fluctuations, reflecting a more consistent cost management strategy.
CNR's significant cost increase, particularly between 2018 and 2022, suggests strategic investments or rising operational costs. Meanwhile, Ferrovial SE's stable cost pattern indicates effective cost control measures. This comparative insight not only highlights the financial strategies of these companies but also offers a glimpse into the broader economic factors influencing the transportation sector.