| __timestamp | Cadence Design Systems, Inc. | Microchip Technology Incorporated |
|---|---|---|
| Wednesday, January 1, 2014 | 223706000 | 802474000 |
| Thursday, January 1, 2015 | 238453000 | 917472000 |
| Friday, January 1, 2016 | 256492000 | 967870000 |
| Sunday, January 1, 2017 | 237390000 | 1650611000 |
| Monday, January 1, 2018 | 258747000 | 1560100000 |
| Tuesday, January 1, 2019 | 266357000 | 2418200000 |
| Wednesday, January 1, 2020 | 305498000 | 2032100000 |
| Friday, January 1, 2021 | 307006000 | 2059600000 |
| Saturday, January 1, 2022 | 371623000 | 2371300000 |
| Sunday, January 1, 2023 | 435041000 | 2740800000 |
| Monday, January 1, 2024 | 210902000 | 2638700000 |
Unlocking the unknown
In the ever-evolving landscape of technology, cost efficiency remains a pivotal factor for success. This analysis delves into the cost of revenue trends for Cadence Design Systems, Inc. and Microchip Technology Incorporated from 2014 to 2023. Over this decade, Microchip consistently outpaced Cadence in cost of revenue, with figures peaking at approximately $2.74 billion in 2023, a 240% increase from 2014. In contrast, Cadence's cost of revenue grew by nearly 95%, reaching around $435 million in 2023. This disparity highlights Microchip's expansive operations and market reach. However, Cadence's more modest growth suggests a strategic focus on efficiency and innovation. Notably, data for Cadence in 2024 is missing, indicating potential shifts or reporting changes. As these tech titans continue to evolve, understanding their financial strategies offers valuable insights into their competitive dynamics.
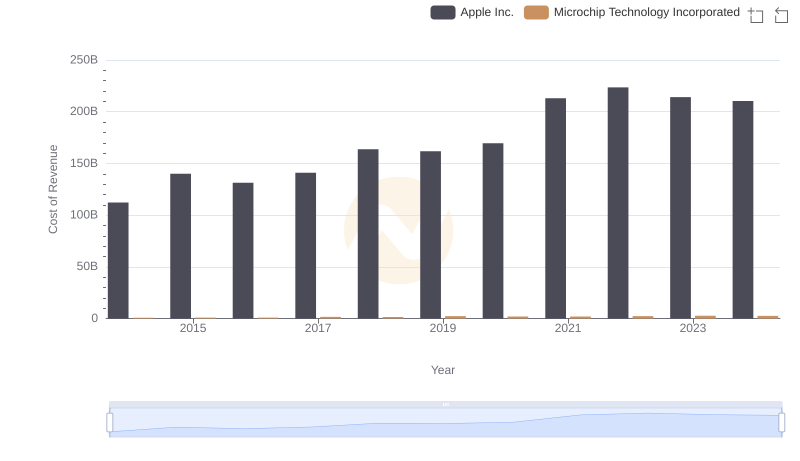
Apple Inc. vs Microchip Technology Incorporated: Efficiency in Cost of Revenue Explored
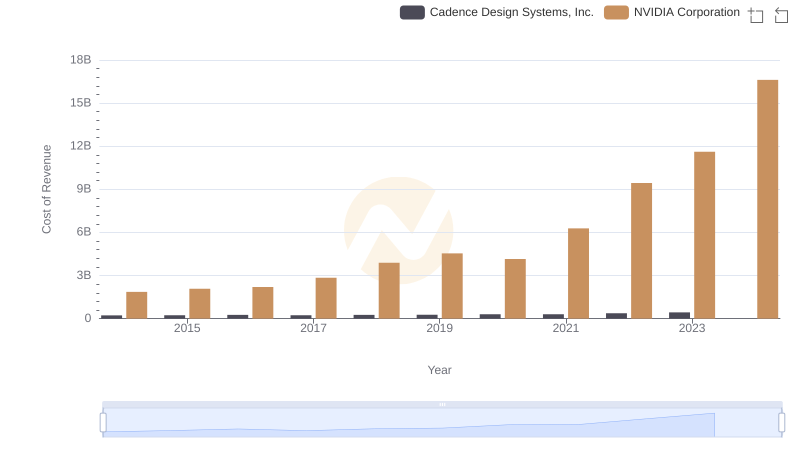
Cost of Revenue Trends: NVIDIA Corporation vs Cadence Design Systems, Inc.
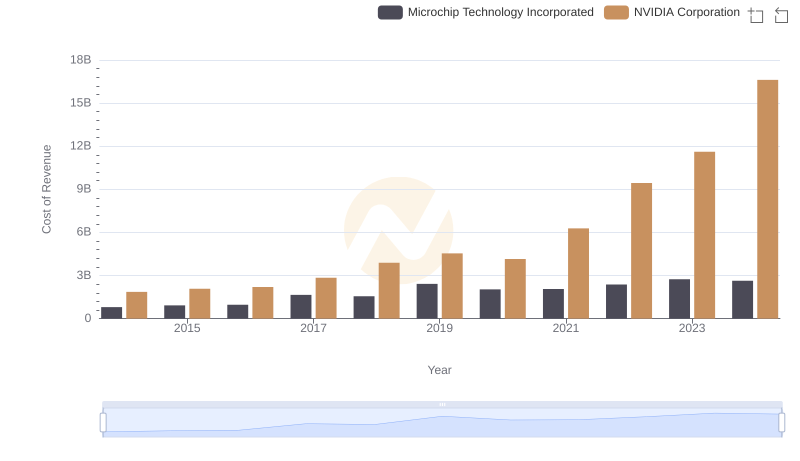
NVIDIA Corporation vs Microchip Technology Incorporated: Efficiency in Cost of Revenue Explored
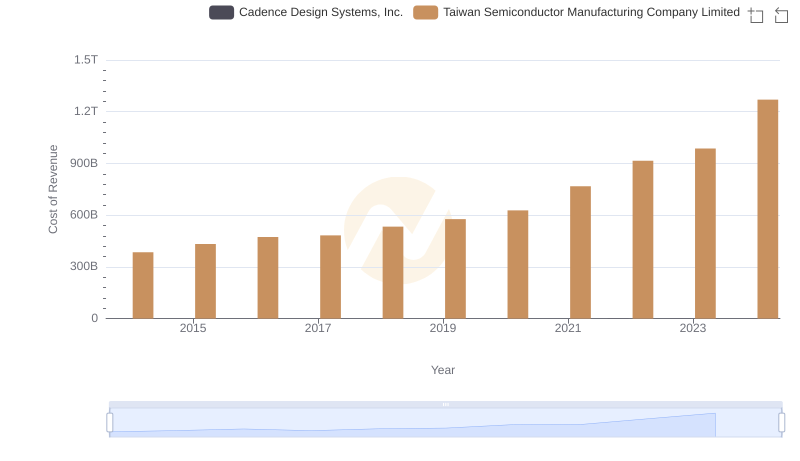
Analyzing Cost of Revenue: Taiwan Semiconductor Manufacturing Company Limited and Cadence Design Systems, Inc.
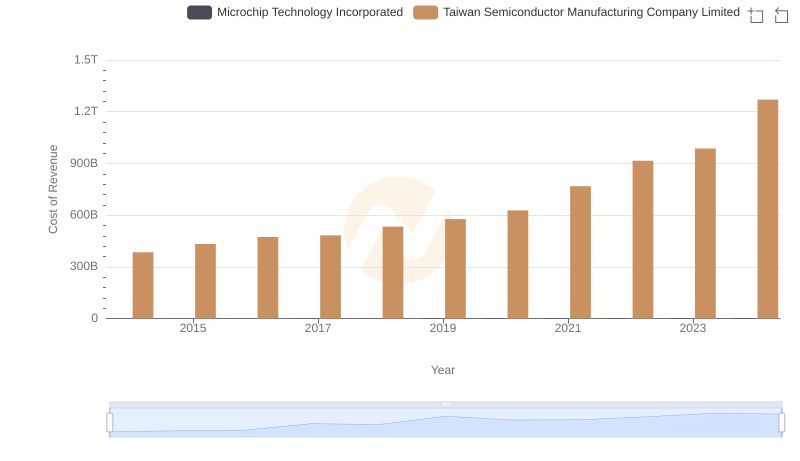
Cost of Revenue Comparison: Taiwan Semiconductor Manufacturing Company Limited vs Microchip Technology Incorporated
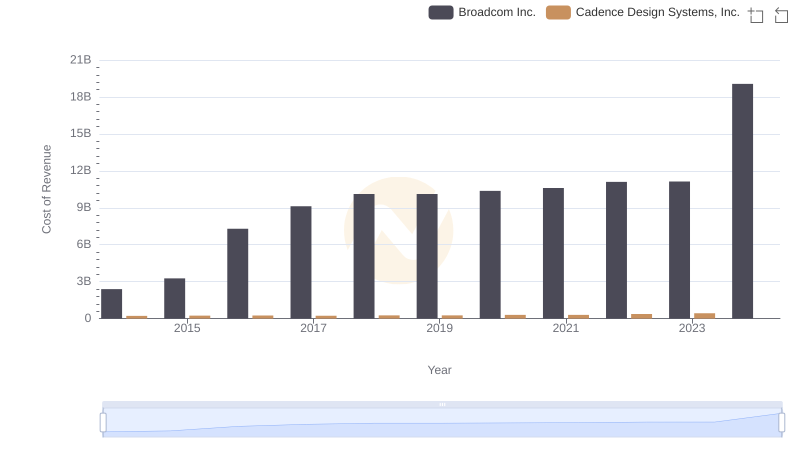
Cost of Revenue: Key Insights for Broadcom Inc. and Cadence Design Systems, Inc.
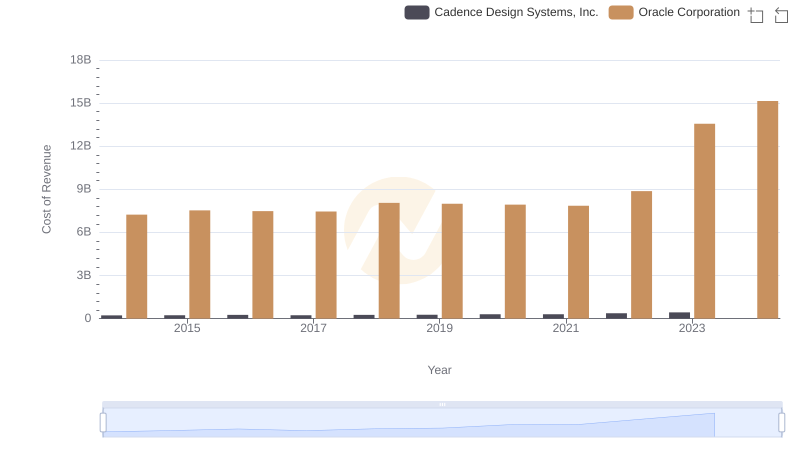
Cost of Revenue Comparison: Oracle Corporation vs Cadence Design Systems, Inc.
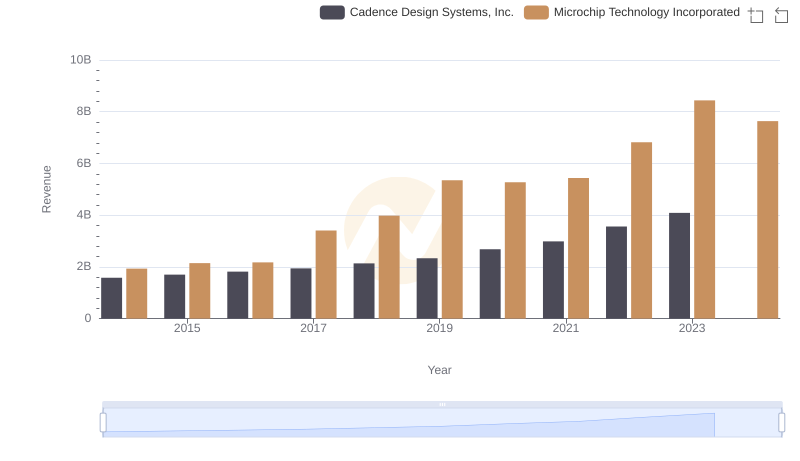
Breaking Down Revenue Trends: Cadence Design Systems, Inc. vs Microchip Technology Incorporated
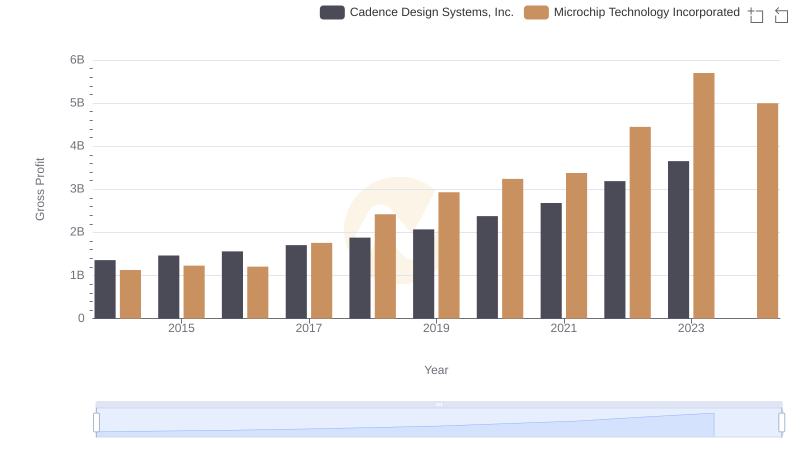
Gross Profit Analysis: Comparing Cadence Design Systems, Inc. and Microchip Technology Incorporated

R&D Spending Showdown: Cadence Design Systems, Inc. vs Microchip Technology Incorporated
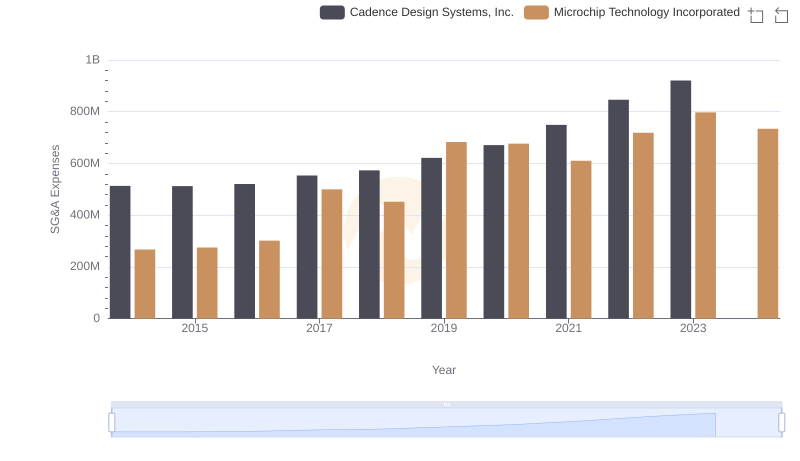
Operational Costs Compared: SG&A Analysis of Cadence Design Systems, Inc. and Microchip Technology Incorporated
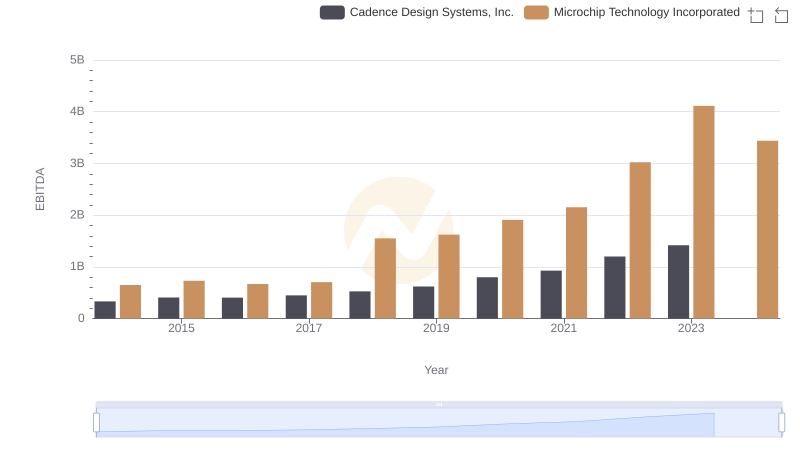
Cadence Design Systems, Inc. and Microchip Technology Incorporated: A Detailed Examination of EBITDA Performance