| __timestamp | Cadence Design Systems, Inc. | Microchip Technology Incorporated |
|---|---|---|
| Wednesday, January 1, 2014 | 1580932000 | 1931217000 |
| Thursday, January 1, 2015 | 1702091000 | 2147036000 |
| Friday, January 1, 2016 | 1816083000 | 2173334000 |
| Sunday, January 1, 2017 | 1943032000 | 3407807000 |
| Monday, January 1, 2018 | 2138022000 | 3980800000 |
| Tuesday, January 1, 2019 | 2336319000 | 5349500000 |
| Wednesday, January 1, 2020 | 2682891000 | 5274200000 |
| Friday, January 1, 2021 | 2988244000 | 5438400000 |
| Saturday, January 1, 2022 | 3561718000 | 6820900000 |
| Sunday, January 1, 2023 | 4089986000 | 8438700000 |
| Monday, January 1, 2024 | 4641264000 | 7634400000 |
Infusing magic into the data realm
In the ever-evolving landscape of technology, understanding revenue trends is crucial for investors and industry enthusiasts alike. Over the past decade, Cadence Design Systems, Inc. and Microchip Technology Incorporated have showcased intriguing revenue trajectories. From 2014 to 2023, Cadence Design Systems saw a steady growth, with revenues increasing by approximately 159%, from $1.58 billion to $4.09 billion. This reflects a robust annual growth rate, highlighting their strategic advancements in electronic design automation.
Conversely, Microchip Technology Incorporated experienced a more volatile yet impressive growth, with revenues surging by around 337% during the same period, peaking at $8.44 billion in 2023. This growth underscores their expanding influence in the semiconductor industry. However, 2024 data for Cadence is missing, leaving room for speculation on their future trajectory. These insights provide a compelling narrative of resilience and innovation in the tech sector.
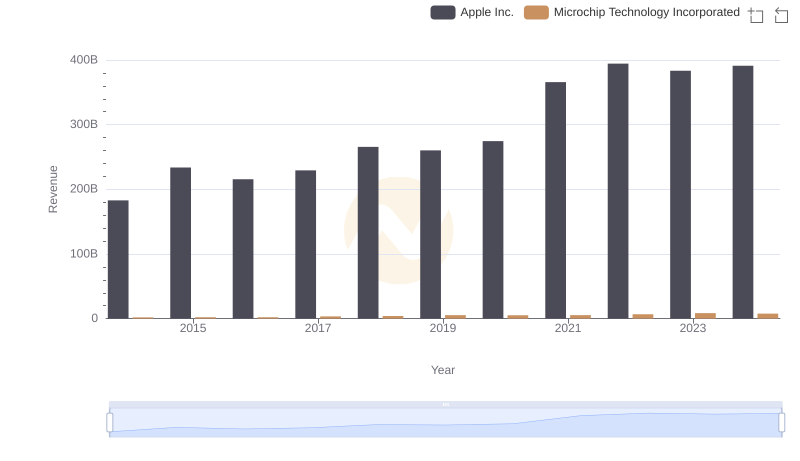
Revenue Showdown: Apple Inc. vs Microchip Technology Incorporated
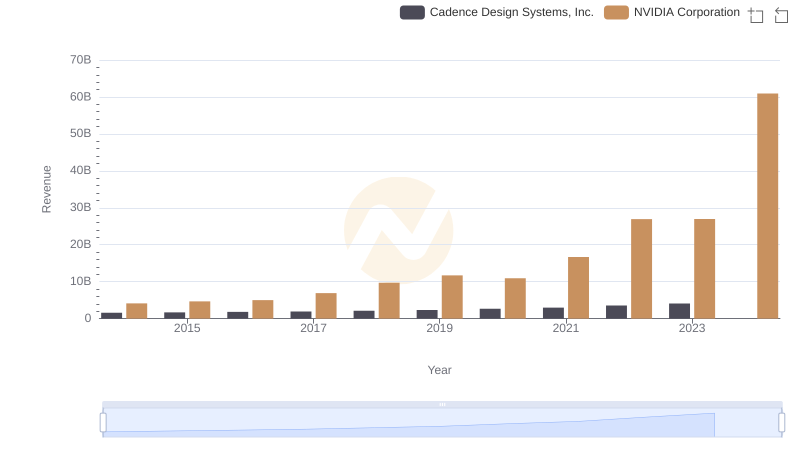
Annual Revenue Comparison: NVIDIA Corporation vs Cadence Design Systems, Inc.
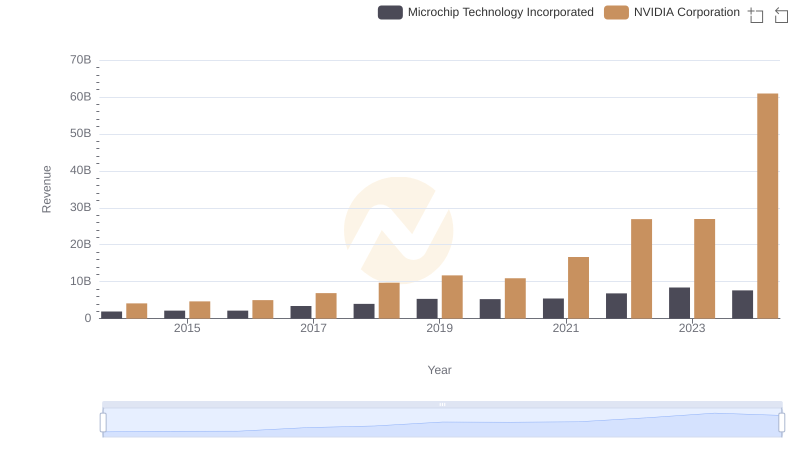
NVIDIA Corporation and Microchip Technology Incorporated: A Comprehensive Revenue Analysis
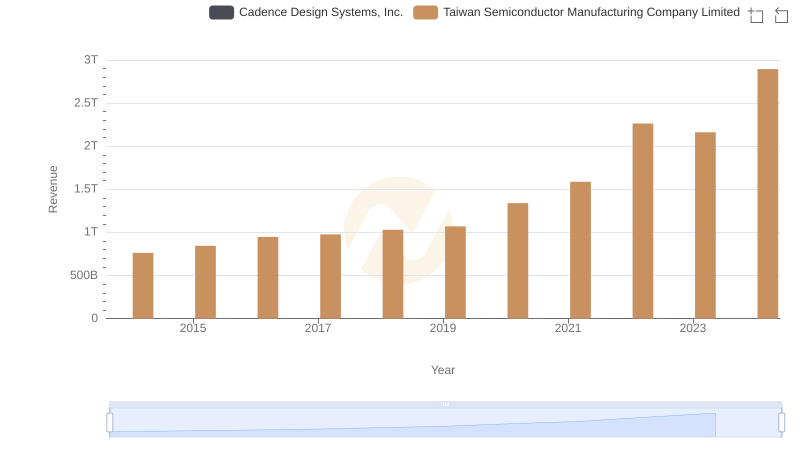
Comparing Revenue Performance: Taiwan Semiconductor Manufacturing Company Limited or Cadence Design Systems, Inc.?

Taiwan Semiconductor Manufacturing Company Limited vs Microchip Technology Incorporated: Examining Key Revenue Metrics
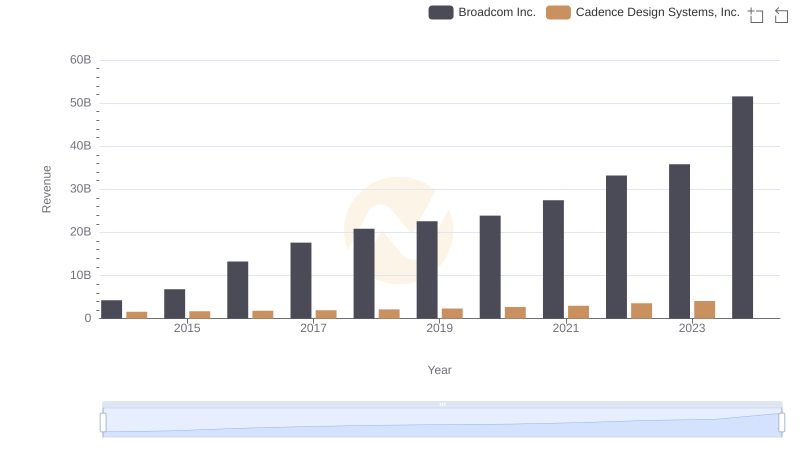
Broadcom Inc. and Cadence Design Systems, Inc.: A Comprehensive Revenue Analysis
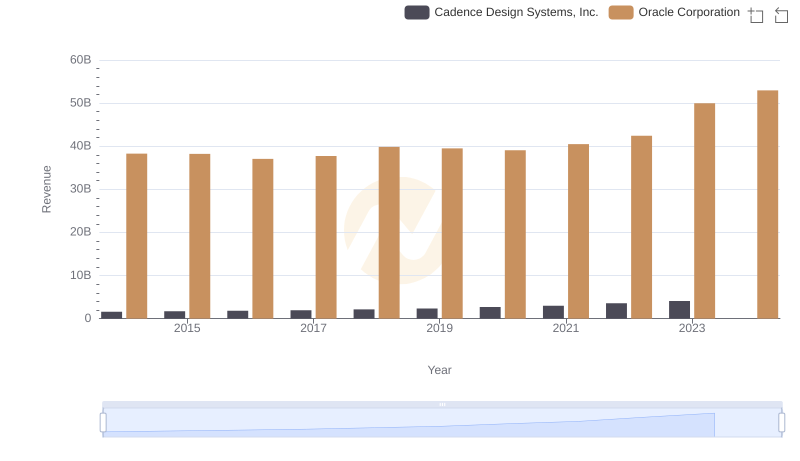
Who Generates More Revenue? Oracle Corporation or Cadence Design Systems, Inc.
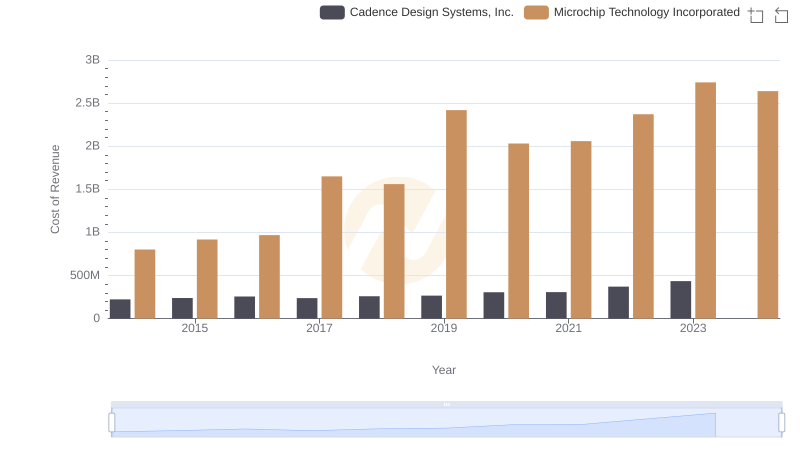
Cadence Design Systems, Inc. vs Microchip Technology Incorporated: Efficiency in Cost of Revenue Explored
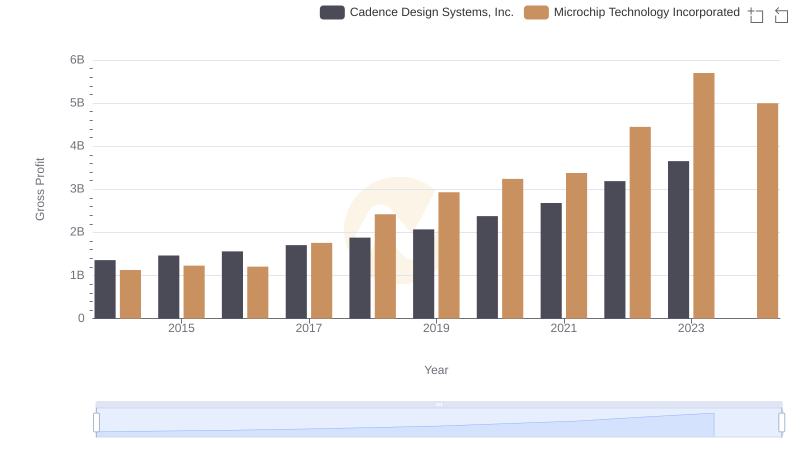
Gross Profit Analysis: Comparing Cadence Design Systems, Inc. and Microchip Technology Incorporated

R&D Spending Showdown: Cadence Design Systems, Inc. vs Microchip Technology Incorporated
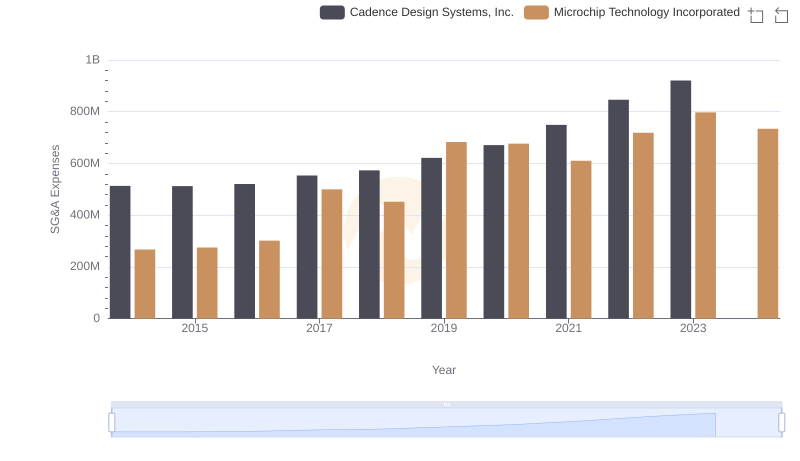
Operational Costs Compared: SG&A Analysis of Cadence Design Systems, Inc. and Microchip Technology Incorporated
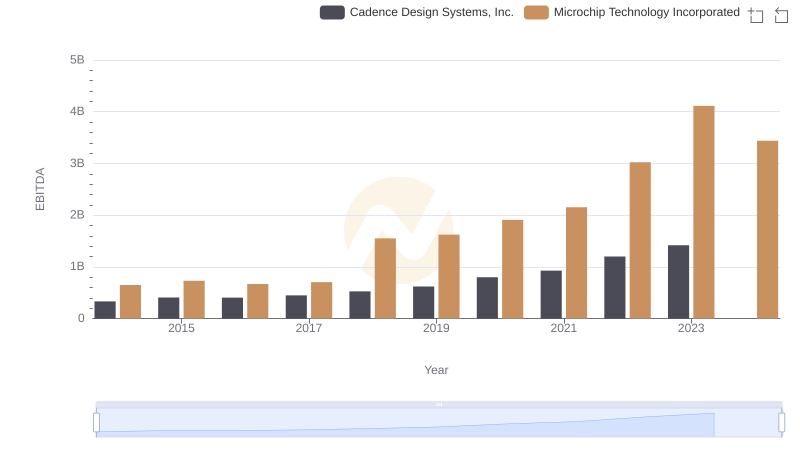
Cadence Design Systems, Inc. and Microchip Technology Incorporated: A Detailed Examination of EBITDA Performance