| __timestamp | Cadence Design Systems, Inc. | Microchip Technology Incorporated |
|---|---|---|
| Wednesday, January 1, 2014 | 1357226000 | 1128743000 |
| Thursday, January 1, 2015 | 1463638000 | 1229564000 |
| Friday, January 1, 2016 | 1559591000 | 1205464000 |
| Sunday, January 1, 2017 | 1705642000 | 1757196000 |
| Monday, January 1, 2018 | 1879275000 | 2420700000 |
| Tuesday, January 1, 2019 | 2069962000 | 2931300000 |
| Wednesday, January 1, 2020 | 2377393000 | 3242100000 |
| Friday, January 1, 2021 | 2681238000 | 3378800000 |
| Saturday, January 1, 2022 | 3190095000 | 4449600000 |
| Sunday, January 1, 2023 | 3654945000 | 5697900000 |
| Monday, January 1, 2024 | 4430362000 | 4995700000 |
Unlocking the unknown
In the ever-evolving landscape of technology, understanding financial performance is crucial. This analysis delves into the gross profit trends of Cadence Design Systems, Inc. and Microchip Technology Incorporated from 2014 to 2023. Over this decade, Microchip Technology consistently outperformed Cadence Design Systems, with a notable 405% increase in gross profit, peaking at approximately $5.7 billion in 2023. In contrast, Cadence Design Systems saw a 169% rise, reaching around $3.65 billion in the same year.
The data reveals a significant growth trajectory for both companies, with Microchip Technology showing a more aggressive upward trend. However, the data for 2024 is incomplete, indicating potential fluctuations. This comparison not only highlights the competitive nature of the tech industry but also underscores the importance of strategic financial planning in maintaining market leadership.
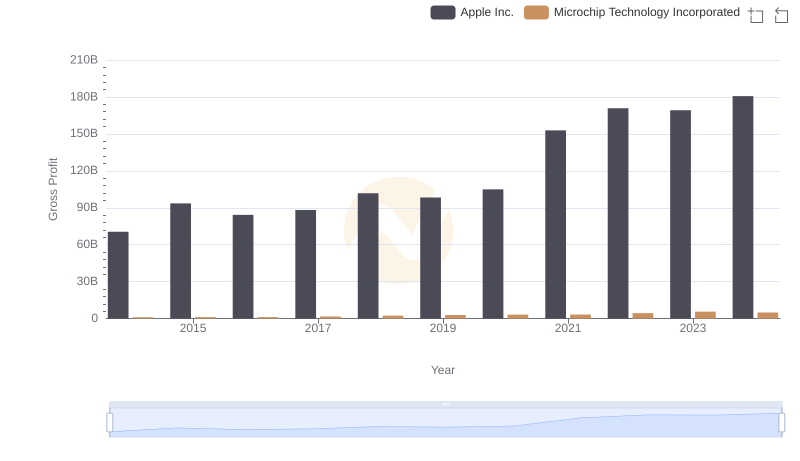
Key Insights on Gross Profit: Apple Inc. vs Microchip Technology Incorporated
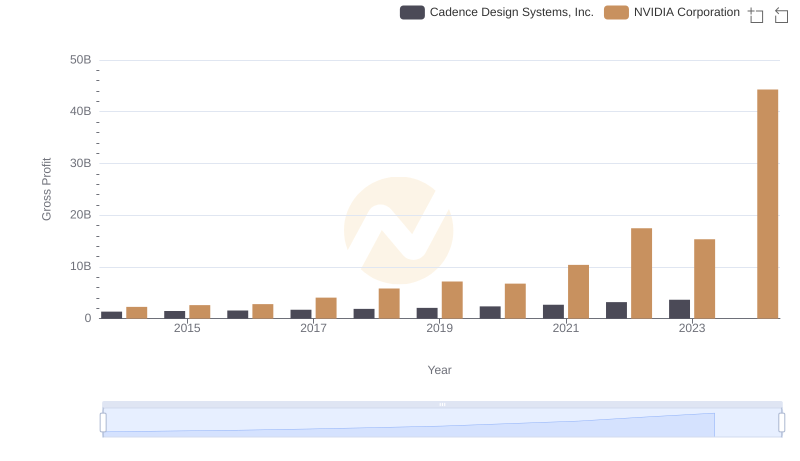
NVIDIA Corporation and Cadence Design Systems, Inc.: A Detailed Gross Profit Analysis
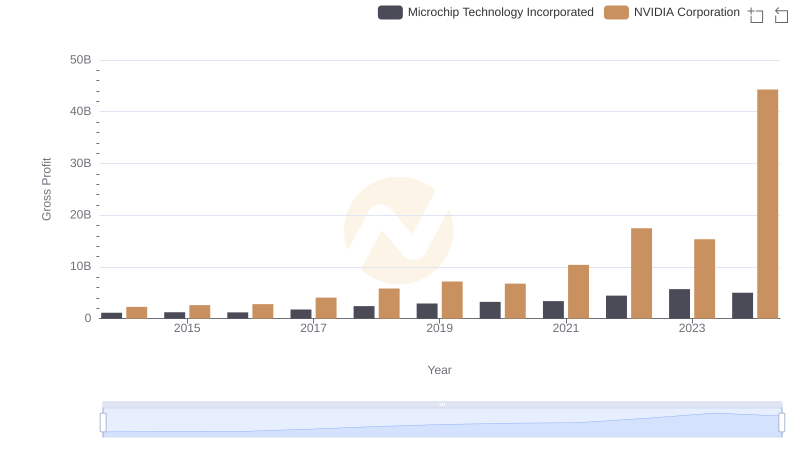
Key Insights on Gross Profit: NVIDIA Corporation vs Microchip Technology Incorporated
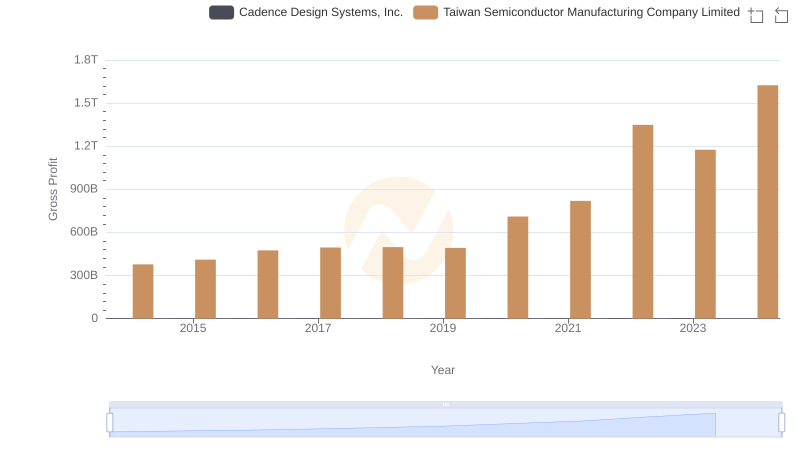
Gross Profit Trends Compared: Taiwan Semiconductor Manufacturing Company Limited vs Cadence Design Systems, Inc.
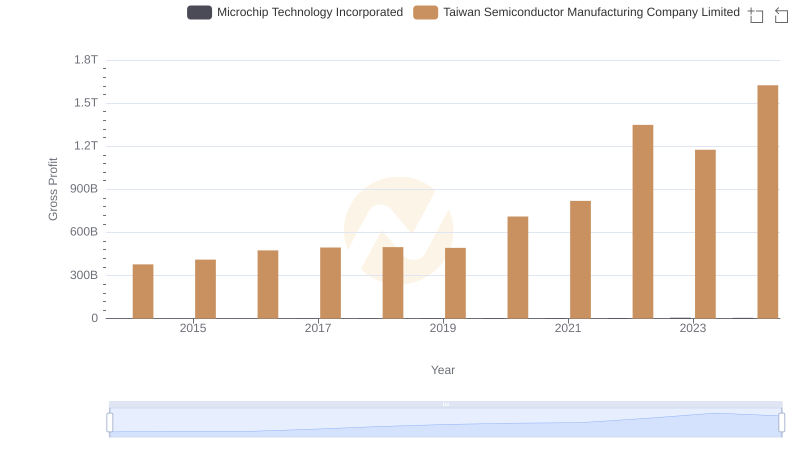
Gross Profit Analysis: Comparing Taiwan Semiconductor Manufacturing Company Limited and Microchip Technology Incorporated
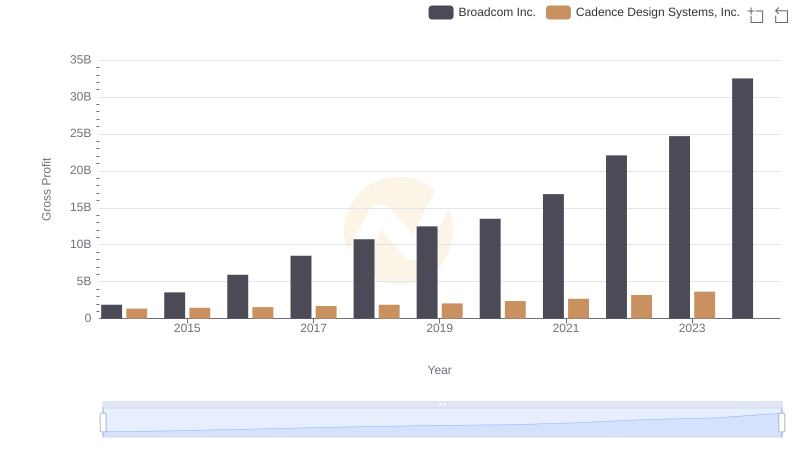
Who Generates Higher Gross Profit? Broadcom Inc. or Cadence Design Systems, Inc.
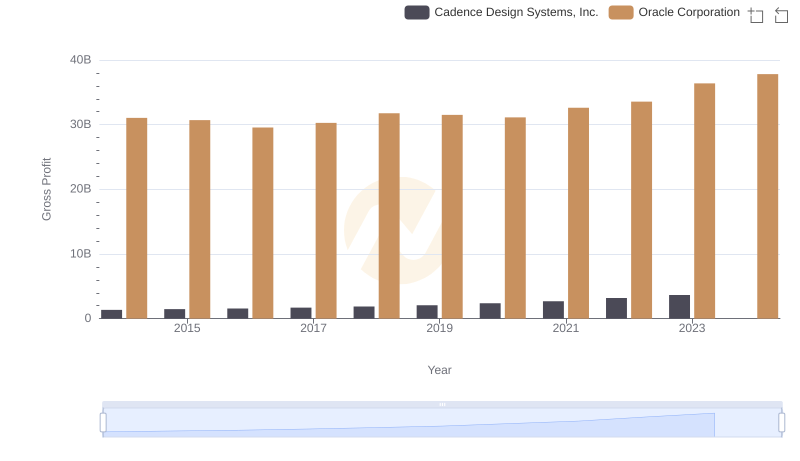
Gross Profit Trends Compared: Oracle Corporation vs Cadence Design Systems, Inc.
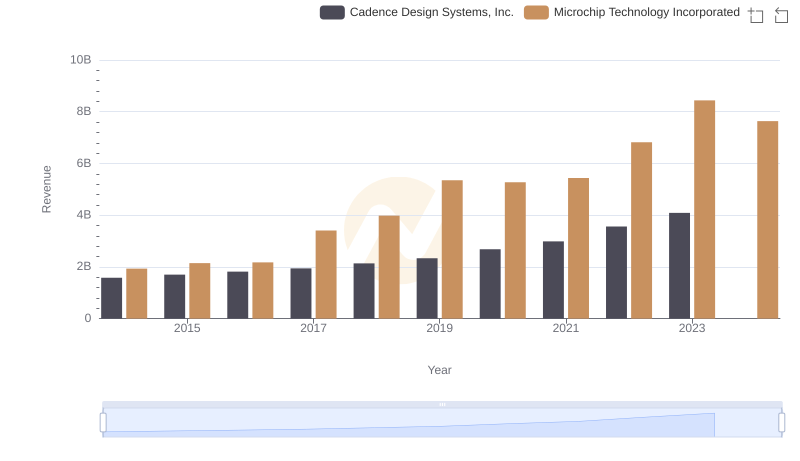
Breaking Down Revenue Trends: Cadence Design Systems, Inc. vs Microchip Technology Incorporated
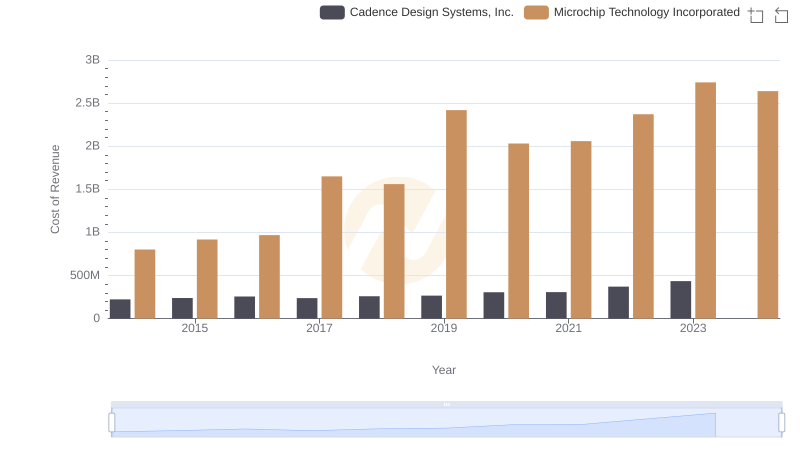
Cadence Design Systems, Inc. vs Microchip Technology Incorporated: Efficiency in Cost of Revenue Explored

R&D Spending Showdown: Cadence Design Systems, Inc. vs Microchip Technology Incorporated
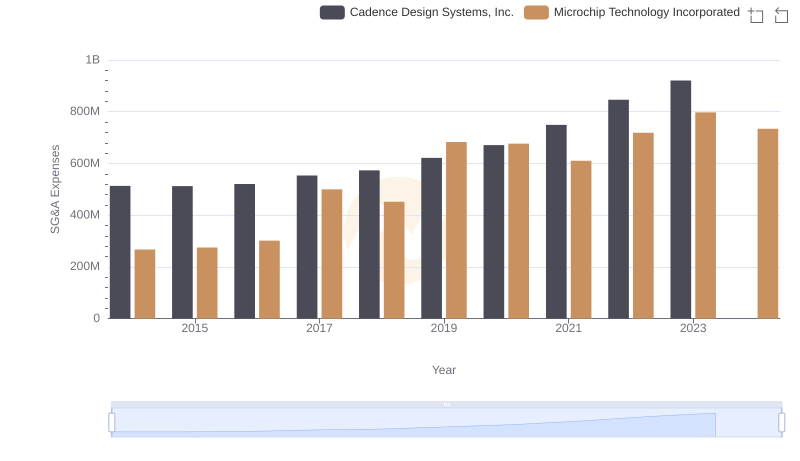
Operational Costs Compared: SG&A Analysis of Cadence Design Systems, Inc. and Microchip Technology Incorporated
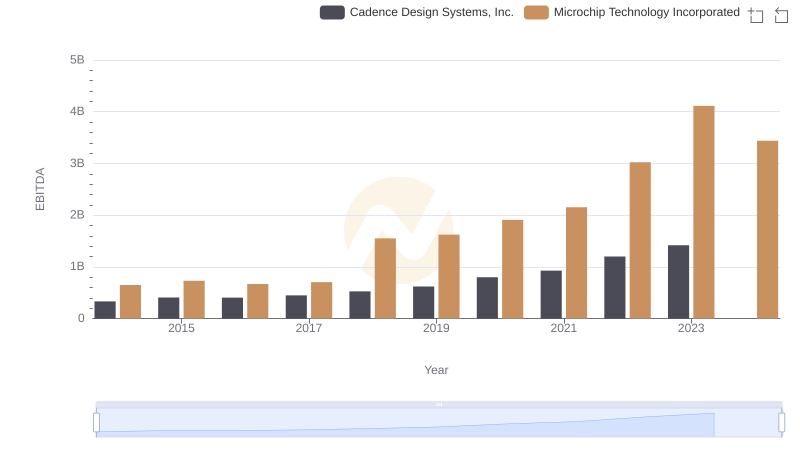
Cadence Design Systems, Inc. and Microchip Technology Incorporated: A Detailed Examination of EBITDA Performance