| __timestamp | Cadence Design Systems, Inc. | Microchip Technology Incorporated |
|---|---|---|
| Wednesday, January 1, 2014 | 332530000 | 651027000 |
| Thursday, January 1, 2015 | 408806000 | 731158000 |
| Friday, January 1, 2016 | 406544000 | 668482000 |
| Sunday, January 1, 2017 | 448885000 | 705341000 |
| Monday, January 1, 2018 | 526019000 | 1552200000 |
| Tuesday, January 1, 2019 | 620586000 | 1624400000 |
| Wednesday, January 1, 2020 | 799150000 | 1909400000 |
| Friday, January 1, 2021 | 927723000 | 2153100000 |
| Saturday, January 1, 2022 | 1200385000 | 3022600000 |
| Sunday, January 1, 2023 | 1419630000 | 4112000000 |
| Monday, January 1, 2024 | 1350763000 | 3438200000 |
Unleashing insights
In the ever-evolving landscape of technology, financial performance is a key indicator of a company's resilience and growth. Over the past decade, Cadence Design Systems, Inc. and Microchip Technology Incorporated have demonstrated remarkable EBITDA growth, reflecting their strategic prowess and market adaptability.
From 2014 to 2023, Cadence Design Systems saw its EBITDA grow by approximately 327%, starting from a modest base and reaching its peak in 2023. Meanwhile, Microchip Technology's EBITDA surged by around 532% during the same period, showcasing its robust expansion strategy.
Interestingly, 2023 marked a significant year for both companies, with Cadence achieving its highest EBITDA, while Microchip Technology continued its upward trajectory. However, data for Cadence in 2024 is missing, leaving room for speculation on its future performance.
This financial journey underscores the dynamic nature of the tech industry and the importance of strategic financial management.
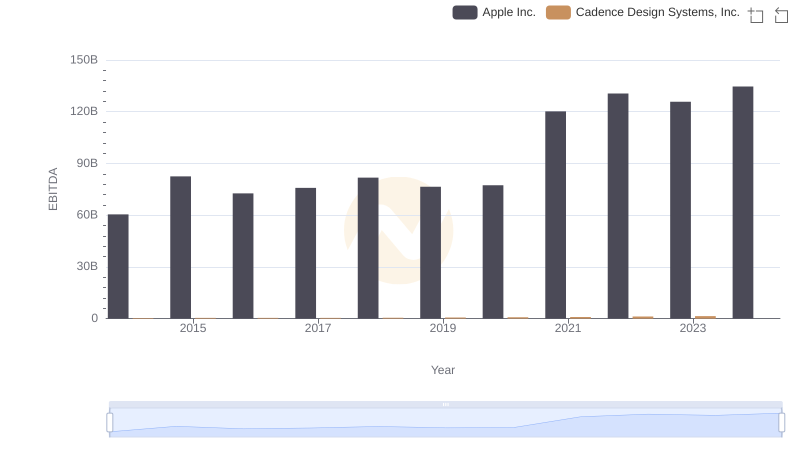
Professional EBITDA Benchmarking: Apple Inc. vs Cadence Design Systems, Inc.
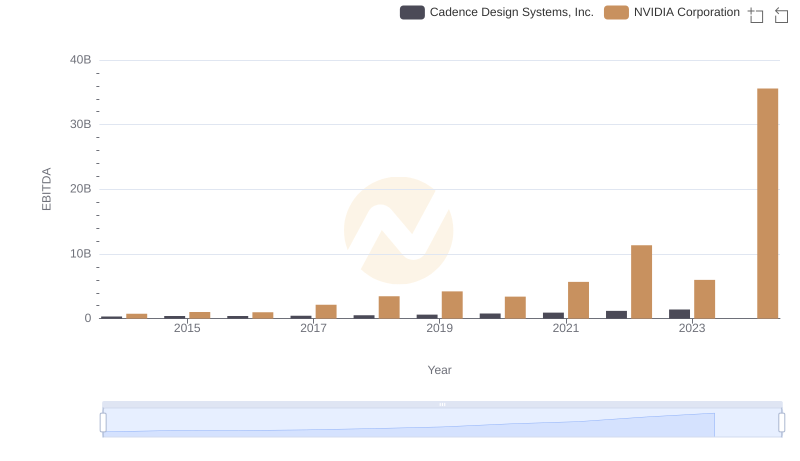
EBITDA Analysis: Evaluating NVIDIA Corporation Against Cadence Design Systems, Inc.
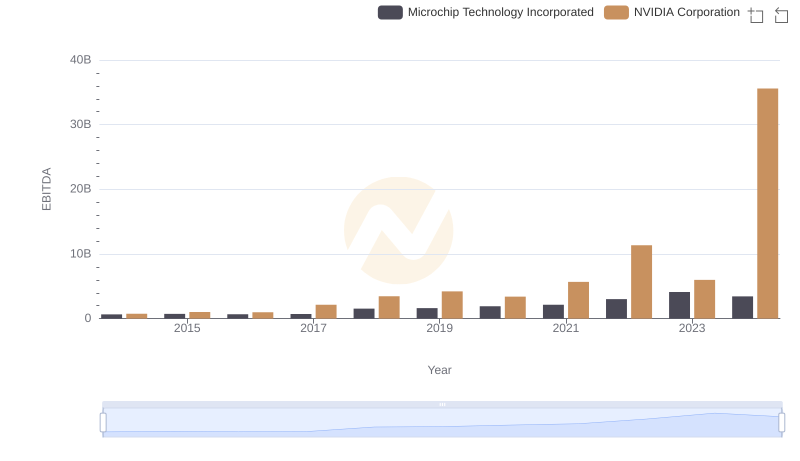
NVIDIA Corporation and Microchip Technology Incorporated: A Detailed Examination of EBITDA Performance
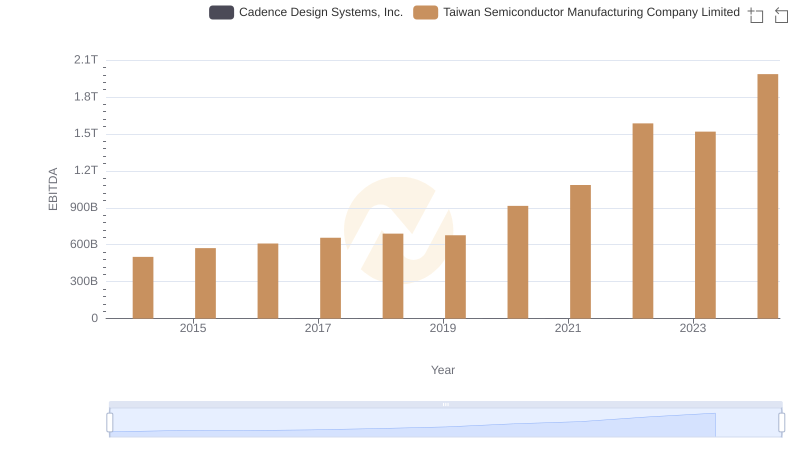
EBITDA Metrics Evaluated: Taiwan Semiconductor Manufacturing Company Limited vs Cadence Design Systems, Inc.
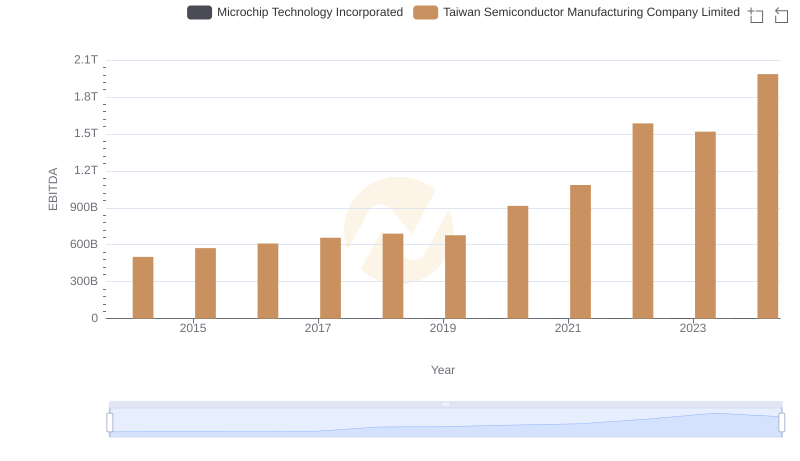
EBITDA Analysis: Evaluating Taiwan Semiconductor Manufacturing Company Limited Against Microchip Technology Incorporated
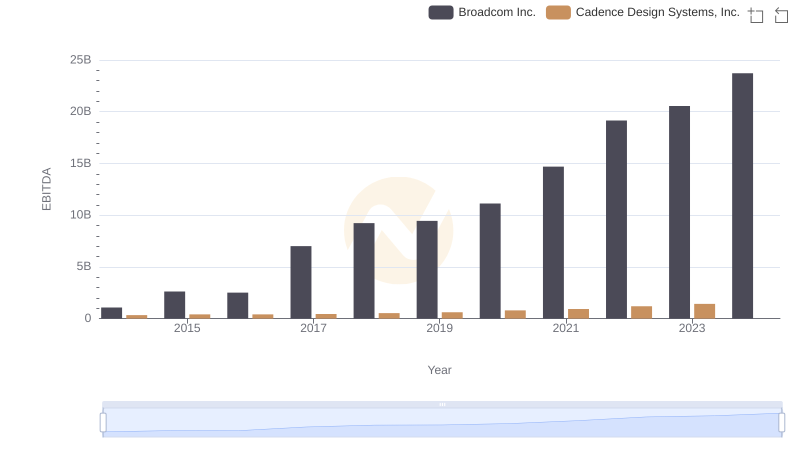
EBITDA Analysis: Evaluating Broadcom Inc. Against Cadence Design Systems, Inc.

Oracle Corporation vs Cadence Design Systems, Inc.: In-Depth EBITDA Performance Comparison
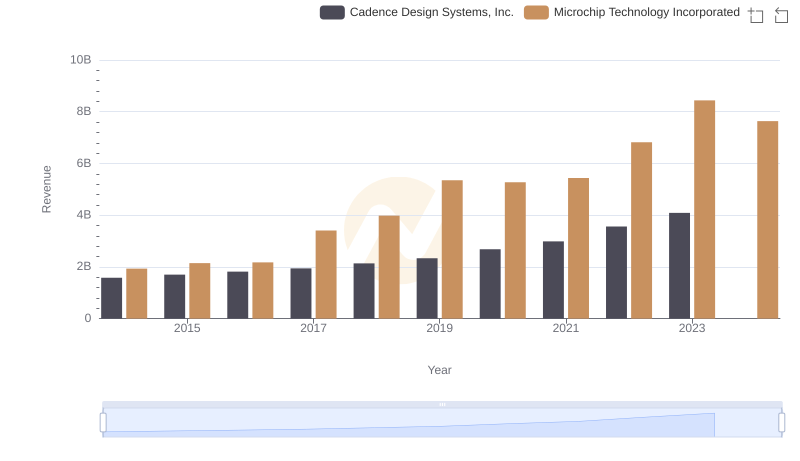
Breaking Down Revenue Trends: Cadence Design Systems, Inc. vs Microchip Technology Incorporated
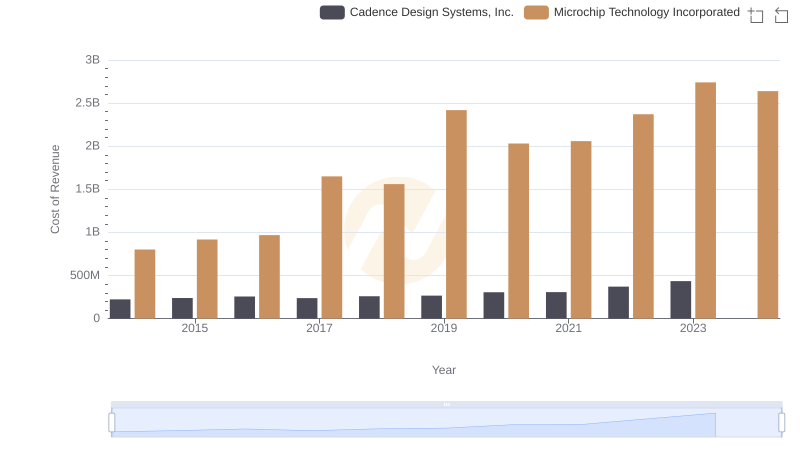
Cadence Design Systems, Inc. vs Microchip Technology Incorporated: Efficiency in Cost of Revenue Explored
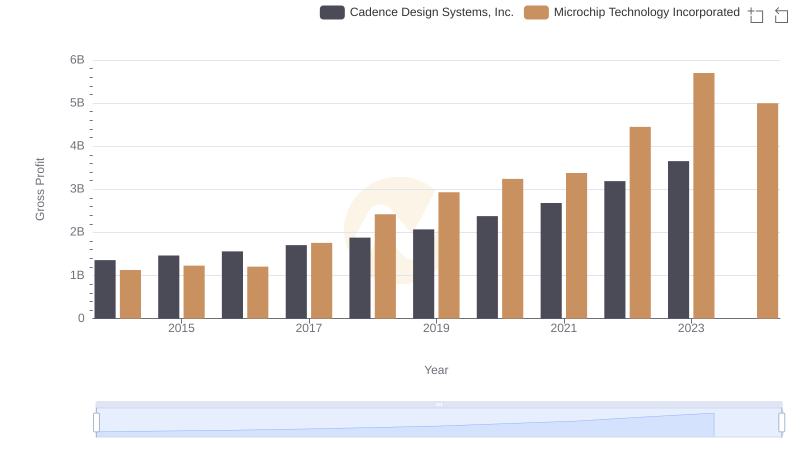
Gross Profit Analysis: Comparing Cadence Design Systems, Inc. and Microchip Technology Incorporated

R&D Spending Showdown: Cadence Design Systems, Inc. vs Microchip Technology Incorporated
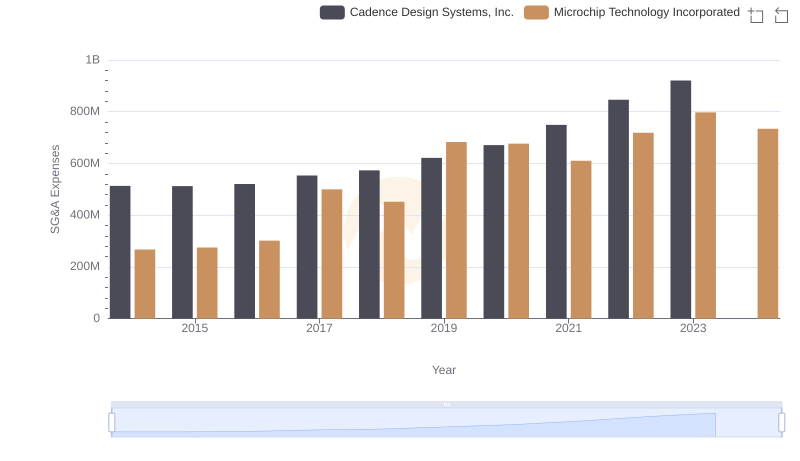
Operational Costs Compared: SG&A Analysis of Cadence Design Systems, Inc. and Microchip Technology Incorporated