| __timestamp | HP Inc. | Motorola Solutions, Inc. |
|---|---|---|
| Wednesday, January 1, 2014 | 13353000000 | 1184000000 |
| Thursday, January 1, 2015 | 4720000000 | 1021000000 |
| Friday, January 1, 2016 | 3840000000 | 1000000000 |
| Sunday, January 1, 2017 | 4376000000 | 979000000 |
| Monday, January 1, 2018 | 4866000000 | 1254000000 |
| Tuesday, January 1, 2019 | 5368000000 | 1403000000 |
| Wednesday, January 1, 2020 | 4906000000 | 1293000000 |
| Friday, January 1, 2021 | 5741000000 | 1353000000 |
| Saturday, January 1, 2022 | 5264000000 | 1450000000 |
| Sunday, January 1, 2023 | 5356000000 | 1561000000 |
| Monday, January 1, 2024 | 5658000000 | 1752000000 |
Unveiling the hidden dimensions of data
In the ever-evolving tech industry, understanding the financial strategies of leading companies is crucial. Over the past decade, HP Inc. and Motorola Solutions, Inc. have showcased distinct approaches in managing their Selling, General, and Administrative (SG&A) expenses. From 2014 to 2023, HP Inc. experienced a significant fluctuation, with a peak in 2014, where expenses were nearly 250% higher than in 2016. Meanwhile, Motorola Solutions maintained a more consistent trajectory, with a steady increase of approximately 60% over the same period. Notably, in 2023, Motorola's SG&A expenses reached their highest, marking a 32% increase from 2014. This data highlights the contrasting financial strategies of these tech giants, offering insights into their operational priorities and market positioning. As we look to the future, these trends may influence their competitive edge in the global market.
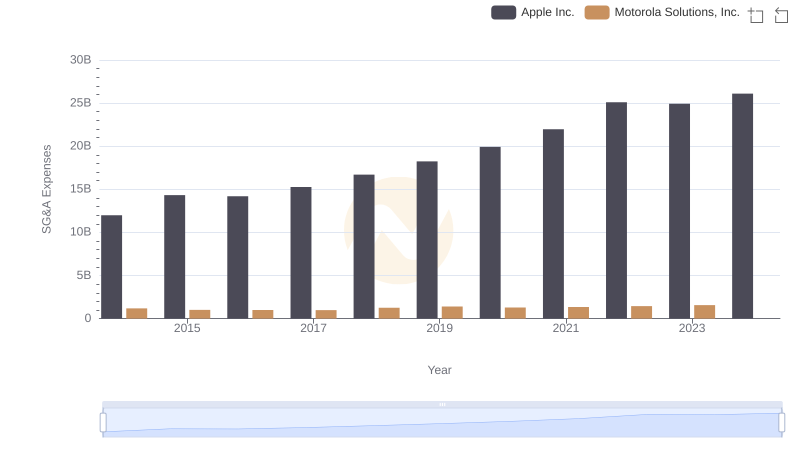
Apple Inc. or Motorola Solutions, Inc.: Who Manages SG&A Costs Better?
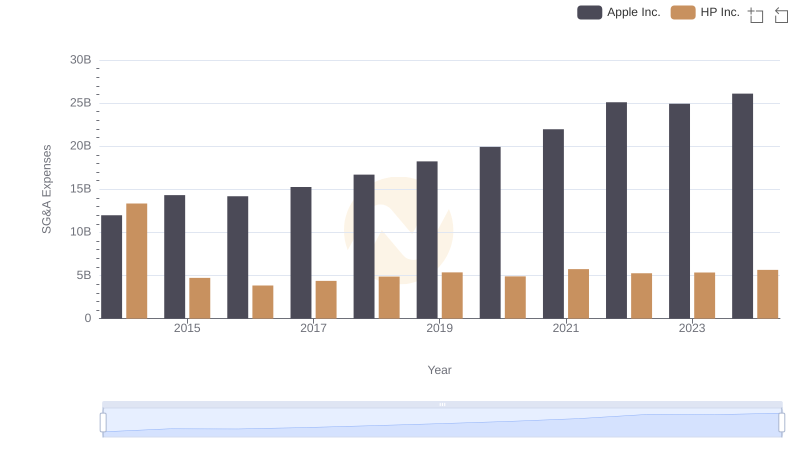
Apple Inc. and HP Inc.: SG&A Spending Patterns Compared
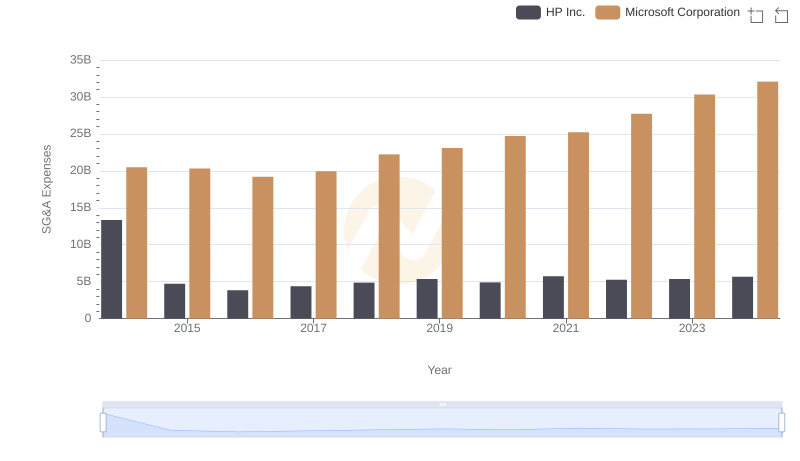
Microsoft Corporation or HP Inc.: Who Manages SG&A Costs Better?
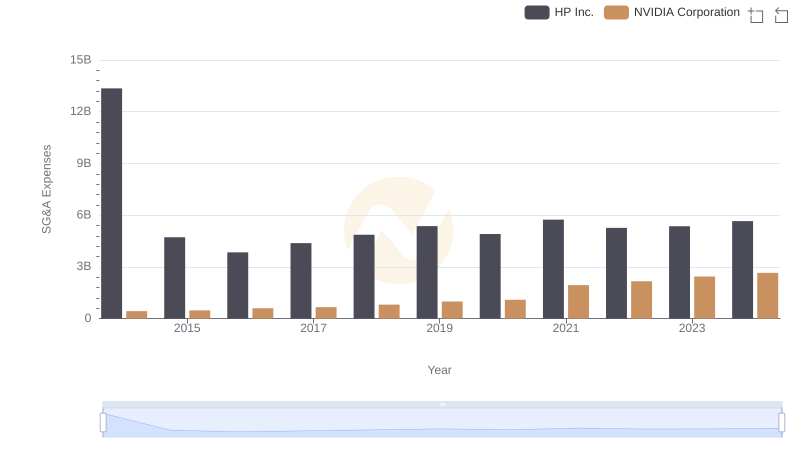
Cost Management Insights: SG&A Expenses for NVIDIA Corporation and HP Inc.
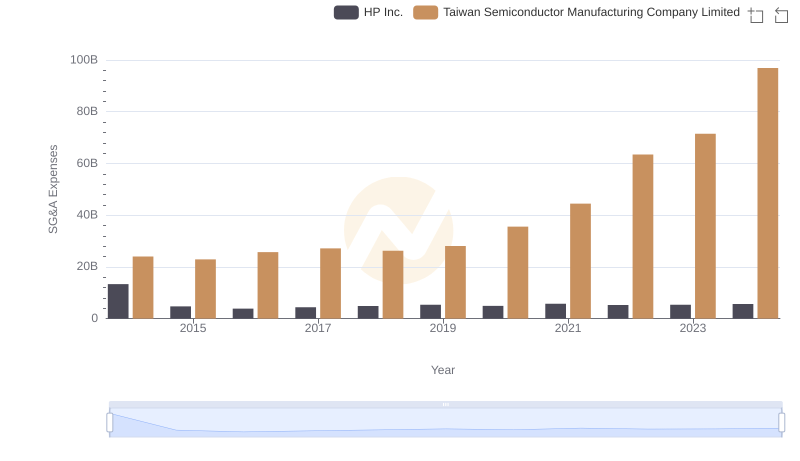
Selling, General, and Administrative Costs: Taiwan Semiconductor Manufacturing Company Limited vs HP Inc.
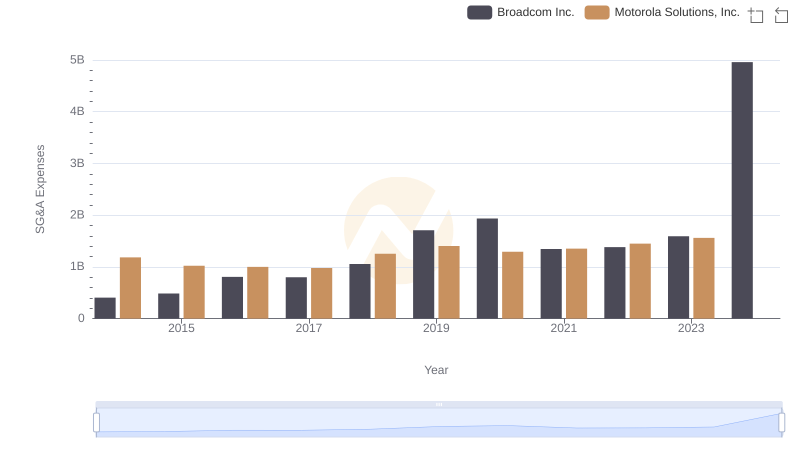
Cost Management Insights: SG&A Expenses for Broadcom Inc. and Motorola Solutions, Inc.
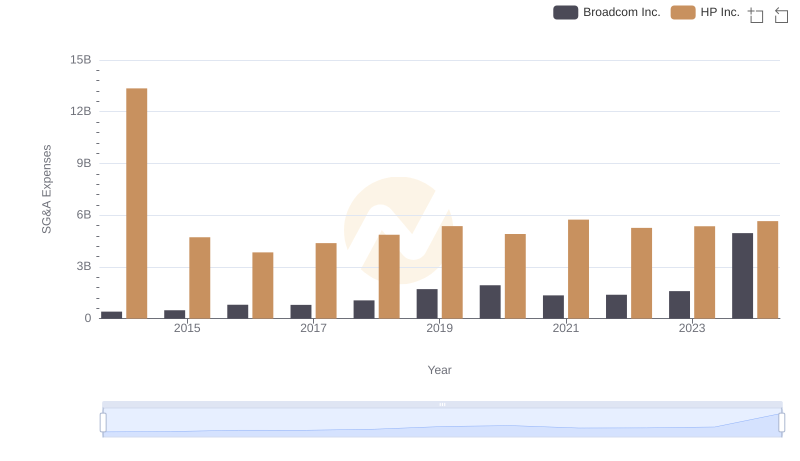
Comparing SG&A Expenses: Broadcom Inc. vs HP Inc. Trends and Insights
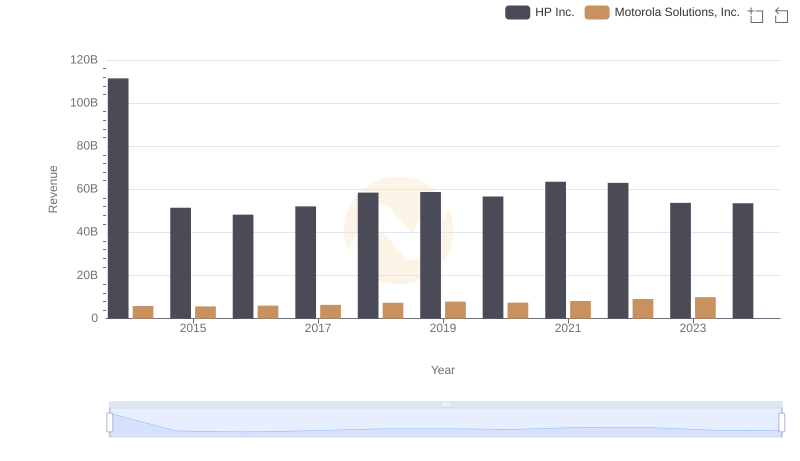
Motorola Solutions, Inc. and HP Inc.: A Comprehensive Revenue Analysis
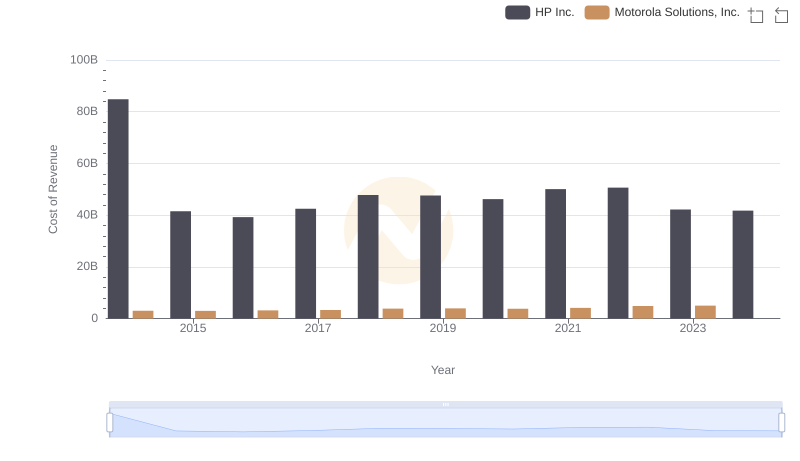
Cost of Revenue: Key Insights for Motorola Solutions, Inc. and HP Inc.
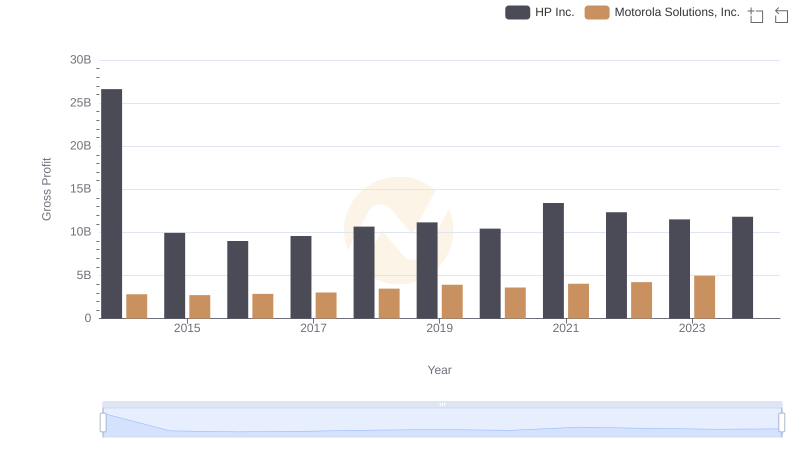
Key Insights on Gross Profit: Motorola Solutions, Inc. vs HP Inc.
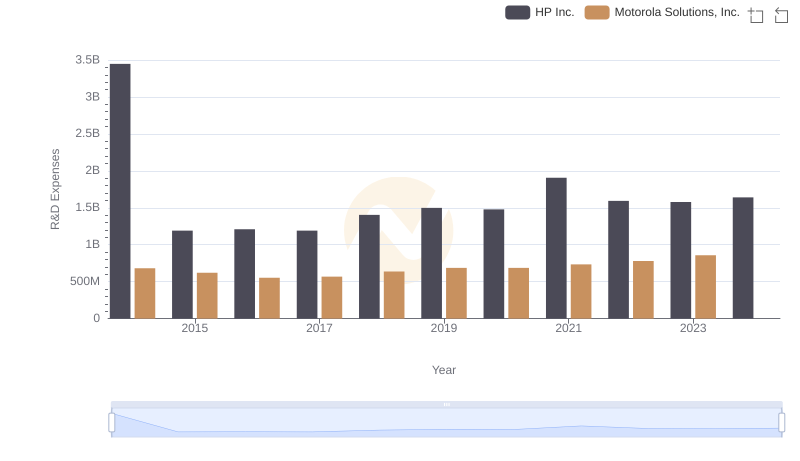
R&D Insights: How Motorola Solutions, Inc. and HP Inc. Allocate Funds