| __timestamp | HP Inc. | Motorola Solutions, Inc. |
|---|---|---|
| Wednesday, January 1, 2014 | 111454000000 | 5881000000 |
| Thursday, January 1, 2015 | 51463000000 | 5695000000 |
| Friday, January 1, 2016 | 48238000000 | 6038000000 |
| Sunday, January 1, 2017 | 52056000000 | 6380000000 |
| Monday, January 1, 2018 | 58472000000 | 7343000000 |
| Tuesday, January 1, 2019 | 58756000000 | 7887000000 |
| Wednesday, January 1, 2020 | 56639000000 | 7414000000 |
| Friday, January 1, 2021 | 63487000000 | 8171000000 |
| Saturday, January 1, 2022 | 62983000000 | 9112000000 |
| Sunday, January 1, 2023 | 53718000000 | 9978000000 |
| Monday, January 1, 2024 | 53559000000 | 10817000000 |
Unveiling the hidden dimensions of data
In the ever-evolving landscape of technology, Motorola Solutions and HP Inc. have carved distinct paths. From 2014 to 2023, HP Inc. experienced a rollercoaster of revenue, peaking in 2014 with a staggering 111 billion USD, only to see a decline to approximately 54 billion USD by 2023. This represents a nearly 52% drop, highlighting the challenges faced in a competitive market.
Conversely, Motorola Solutions showcased a steady growth trajectory. Starting at around 5.9 billion USD in 2014, their revenue climbed to nearly 10 billion USD by 2023, marking a robust 70% increase. This growth underscores Motorola's strategic focus on innovation and resilience.
While HP Inc. faced fluctuations, Motorola Solutions' consistent rise paints a picture of stability and adaptability. As we look to the future, these trends offer valuable insights into the dynamic world of technology.
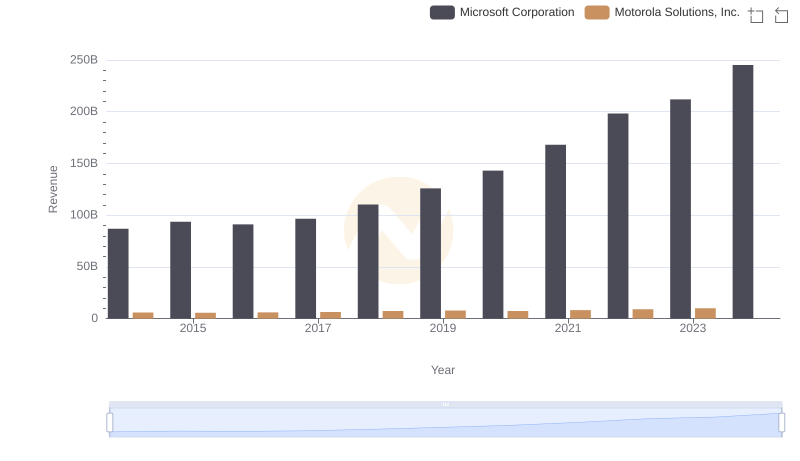
Annual Revenue Comparison: Microsoft Corporation vs Motorola Solutions, Inc.
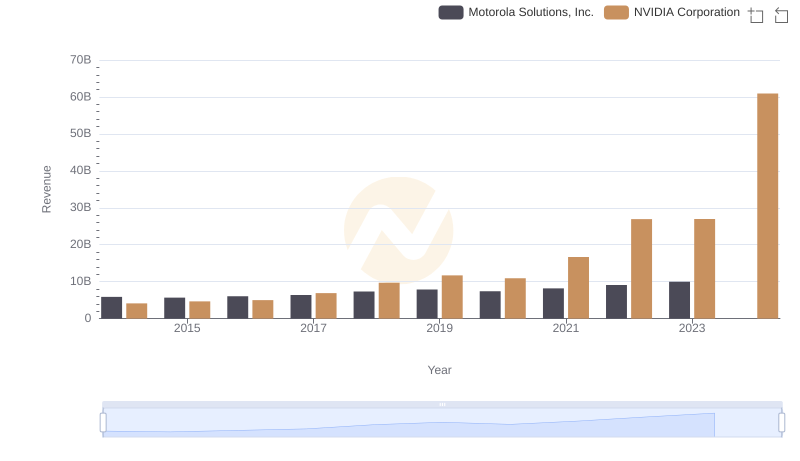
Comparing Revenue Performance: NVIDIA Corporation or Motorola Solutions, Inc.?
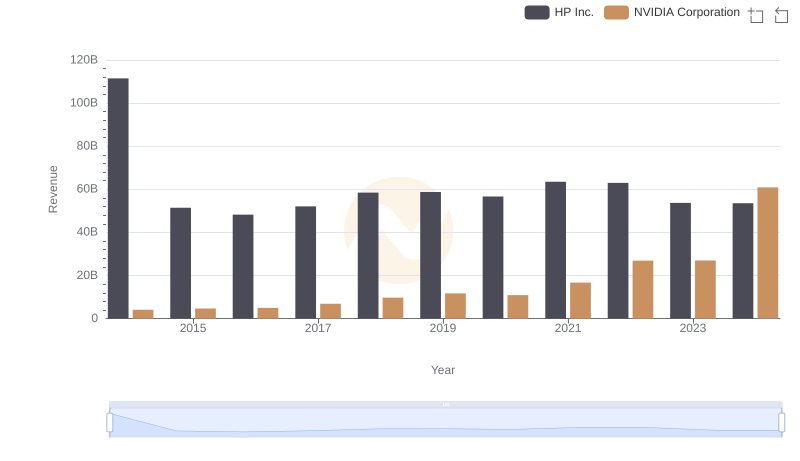
Comparing Revenue Performance: NVIDIA Corporation or HP Inc.?
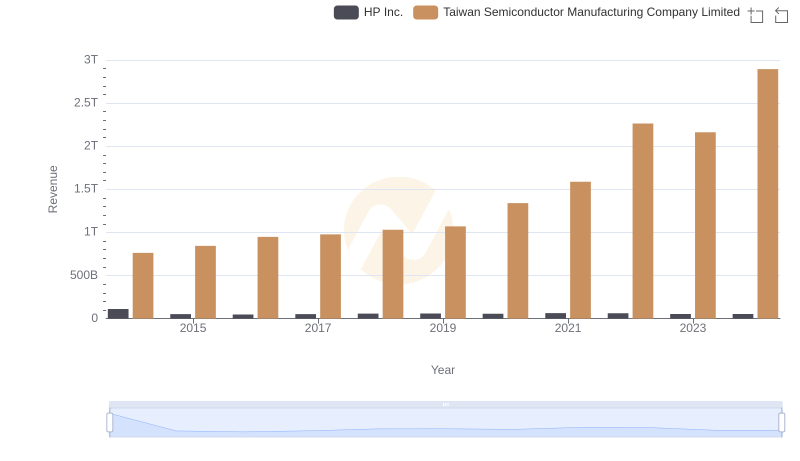
Taiwan Semiconductor Manufacturing Company Limited and HP Inc.: A Comprehensive Revenue Analysis
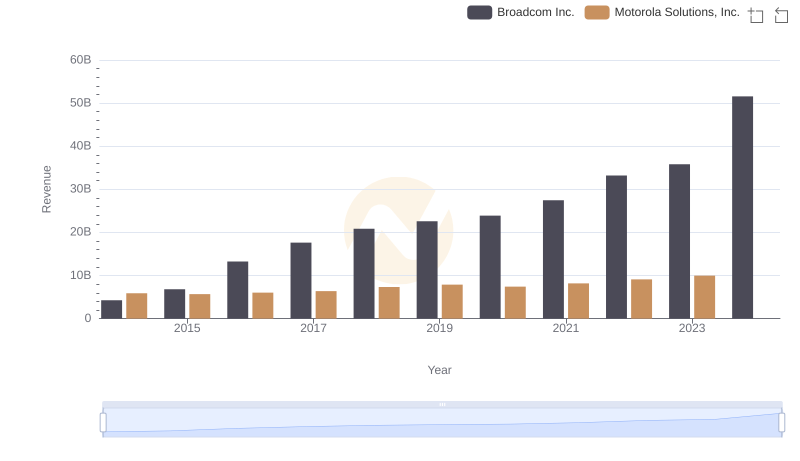
Comparing Revenue Performance: Broadcom Inc. or Motorola Solutions, Inc.?
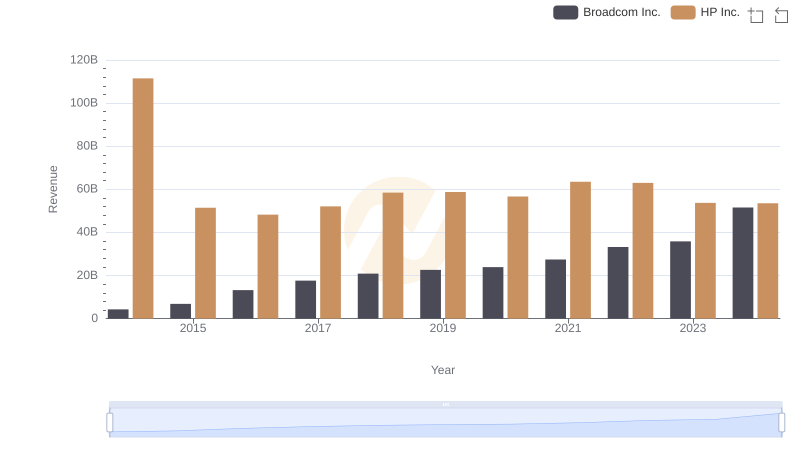
Broadcom Inc. vs HP Inc.: Annual Revenue Growth Compared
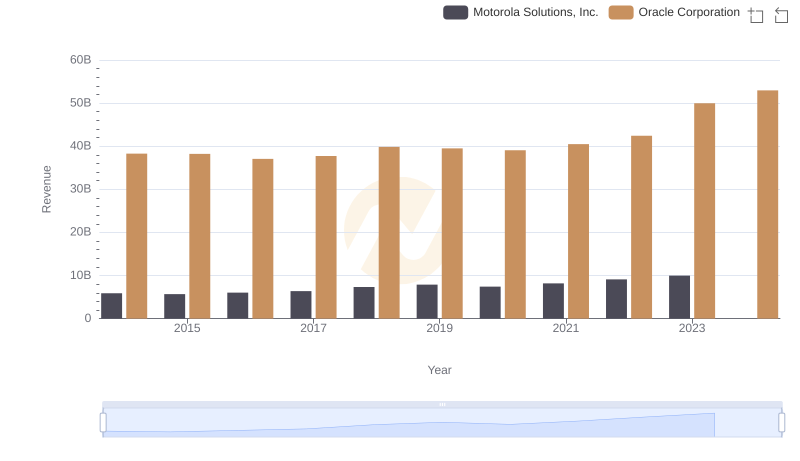
Revenue Showdown: Oracle Corporation vs Motorola Solutions, Inc.
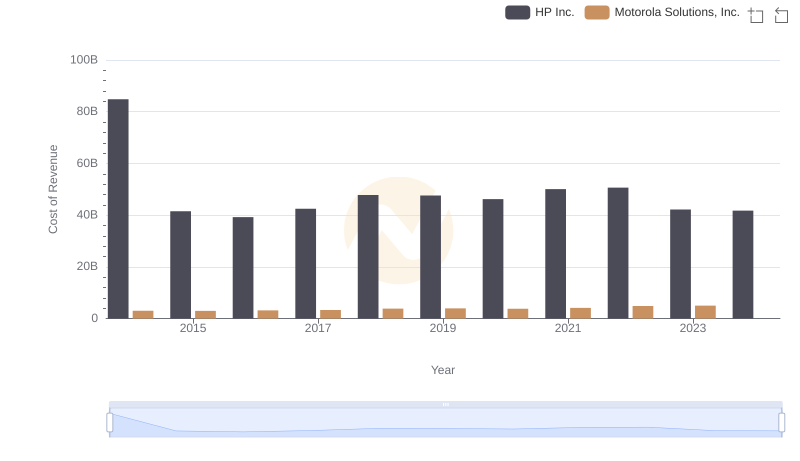
Cost of Revenue: Key Insights for Motorola Solutions, Inc. and HP Inc.
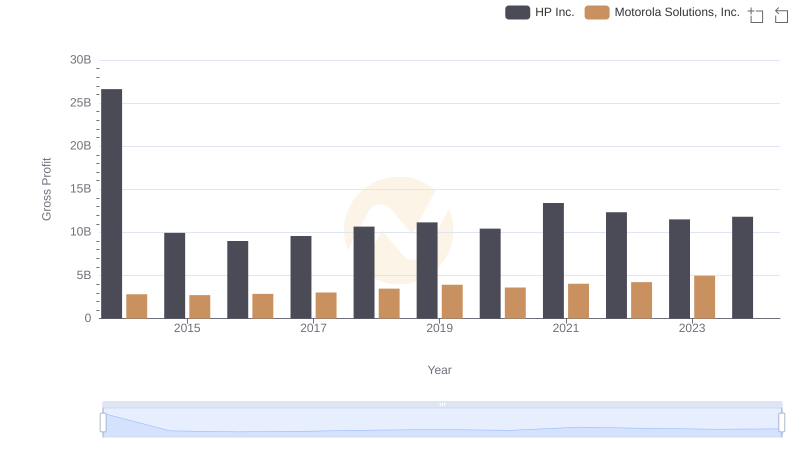
Key Insights on Gross Profit: Motorola Solutions, Inc. vs HP Inc.
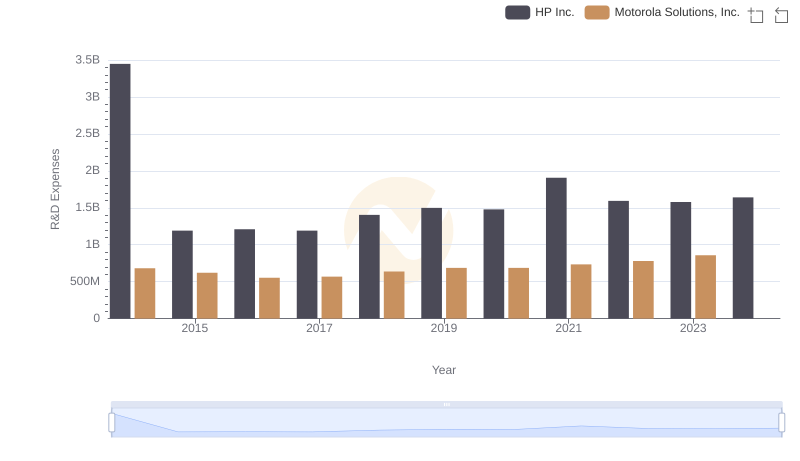
R&D Insights: How Motorola Solutions, Inc. and HP Inc. Allocate Funds
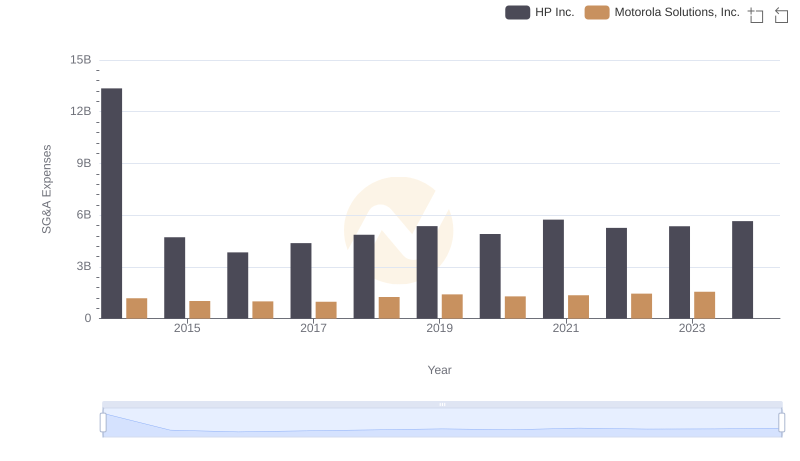
Breaking Down SG&A Expenses: Motorola Solutions, Inc. vs HP Inc.