| __timestamp | HP Inc. | Motorola Solutions, Inc. |
|---|---|---|
| Wednesday, January 1, 2014 | 84839000000 | 3050000000 |
| Thursday, January 1, 2015 | 41524000000 | 2976000000 |
| Friday, January 1, 2016 | 39240000000 | 3169000000 |
| Sunday, January 1, 2017 | 42478000000 | 3356000000 |
| Monday, January 1, 2018 | 47803000000 | 3863000000 |
| Tuesday, January 1, 2019 | 47586000000 | 3956000000 |
| Wednesday, January 1, 2020 | 46202000000 | 3806000000 |
| Friday, January 1, 2021 | 50070000000 | 4131000000 |
| Saturday, January 1, 2022 | 50648000000 | 4883000000 |
| Sunday, January 1, 2023 | 42210000000 | 5008000000 |
| Monday, January 1, 2024 | 41741000000 | 5305000000 |
Infusing magic into the data realm
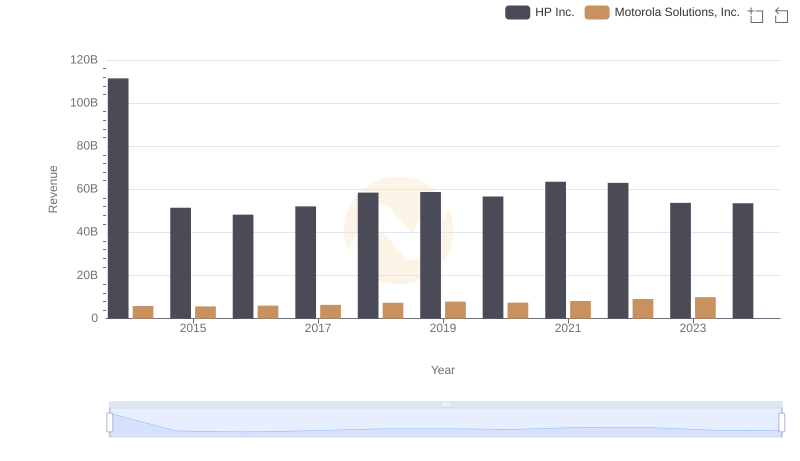
In the ever-evolving landscape of technology, understanding the cost of revenue is crucial for assessing a company's financial health. Over the past decade, HP Inc. and Motorola Solutions, Inc. have shown distinct trends in their cost of revenue. From 2014 to 2023, HP Inc. experienced a significant decline of nearly 50% in its cost of revenue, starting at approximately $84.8 billion and stabilizing around $42.2 billion. This reduction reflects HP's strategic cost management and operational efficiency.
Conversely, Motorola Solutions, Inc. has seen a steady increase, with its cost of revenue rising from $3.05 billion in 2014 to $5.01 billion in 2023, marking a growth of about 64%. This upward trend indicates Motorola's expanding market presence and investment in product development. Notably, data for 2024 is incomplete, highlighting the dynamic nature of financial forecasting.
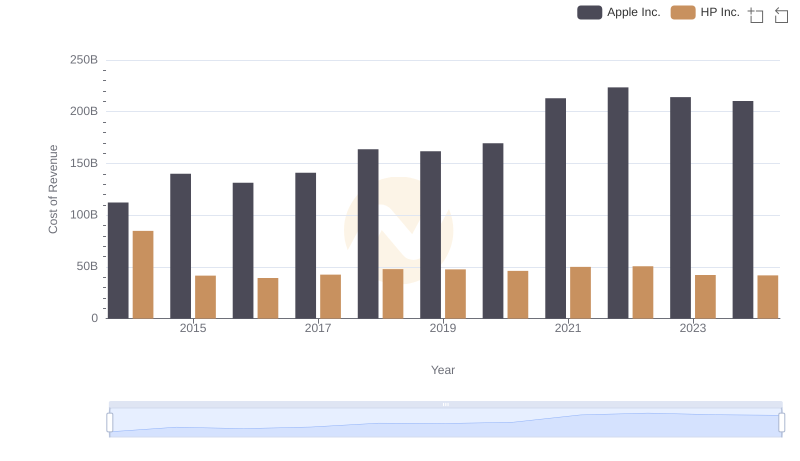
Cost of Revenue Comparison: Apple Inc. vs HP Inc.
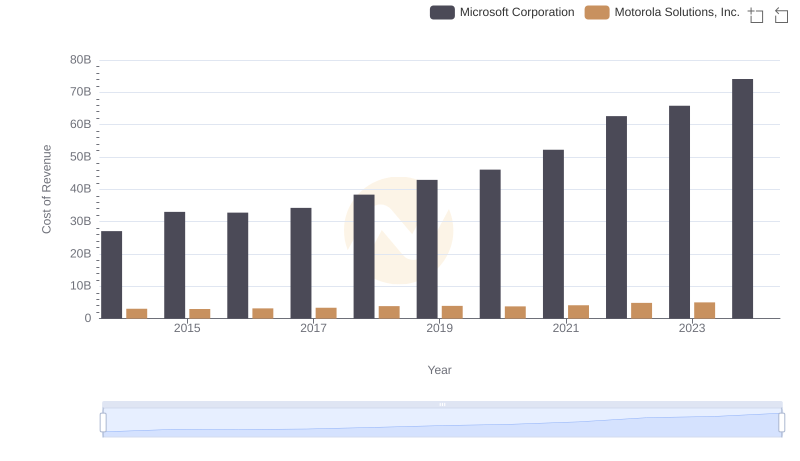
Cost Insights: Breaking Down Microsoft Corporation and Motorola Solutions, Inc.'s Expenses

Analyzing Cost of Revenue: NVIDIA Corporation and Motorola Solutions, Inc.
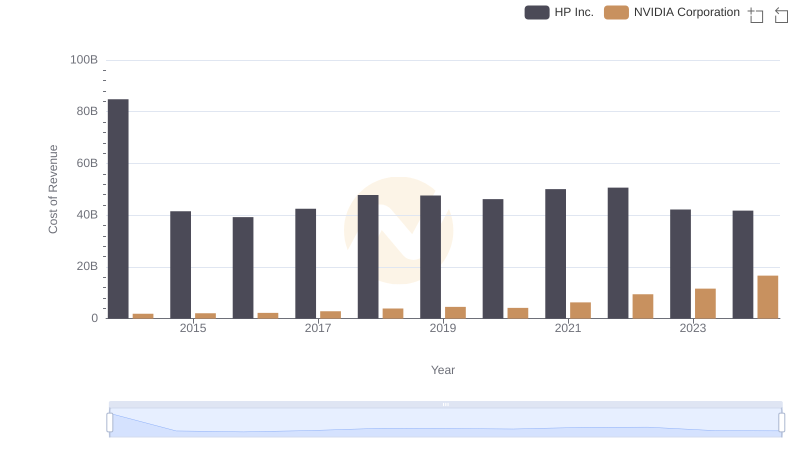
Cost Insights: Breaking Down NVIDIA Corporation and HP Inc.'s Expenses
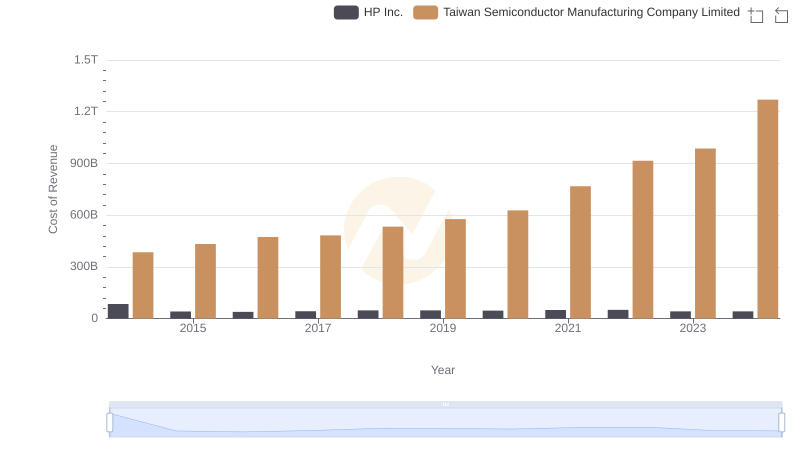
Cost of Revenue Comparison: Taiwan Semiconductor Manufacturing Company Limited vs HP Inc.
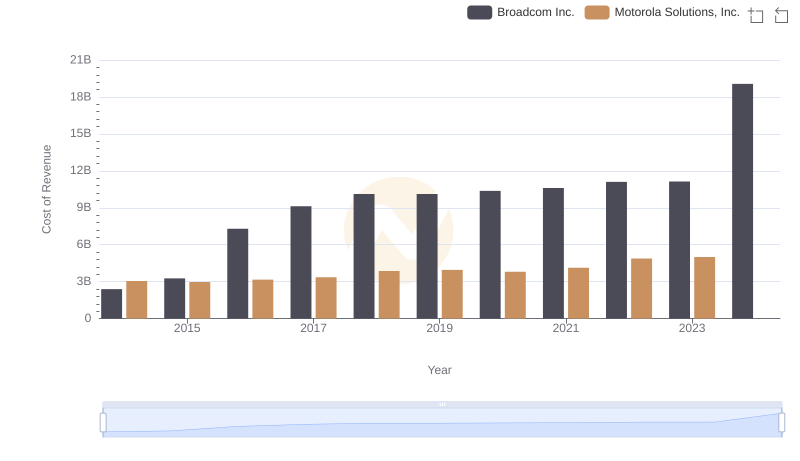
Comparing Cost of Revenue Efficiency: Broadcom Inc. vs Motorola Solutions, Inc.
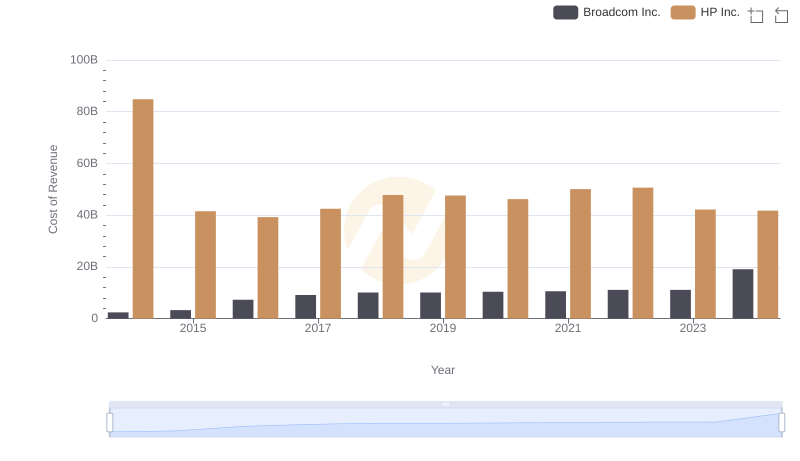
Cost Insights: Breaking Down Broadcom Inc. and HP Inc.'s Expenses
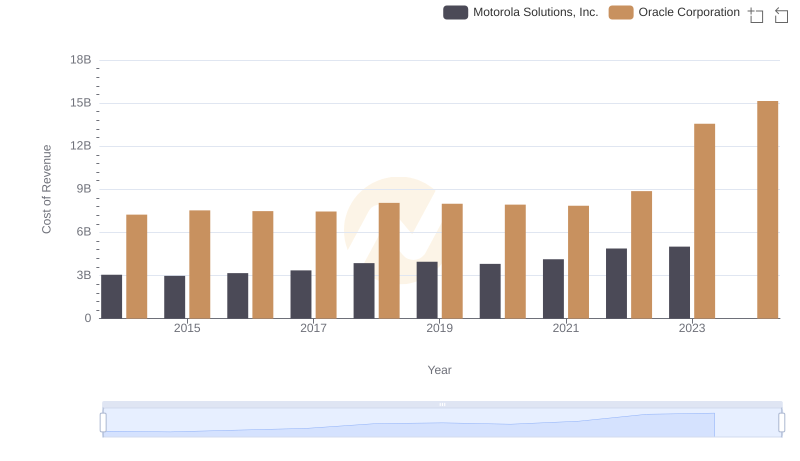
Analyzing Cost of Revenue: Oracle Corporation and Motorola Solutions, Inc.
Motorola Solutions, Inc. and HP Inc.: A Comprehensive Revenue Analysis
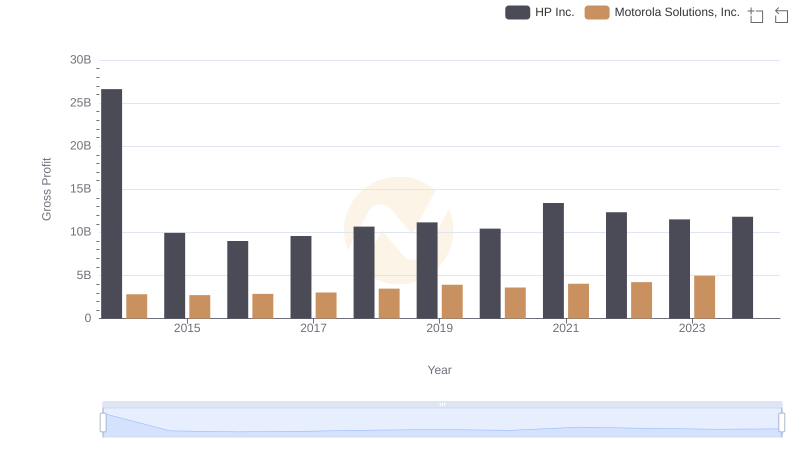
Key Insights on Gross Profit: Motorola Solutions, Inc. vs HP Inc.
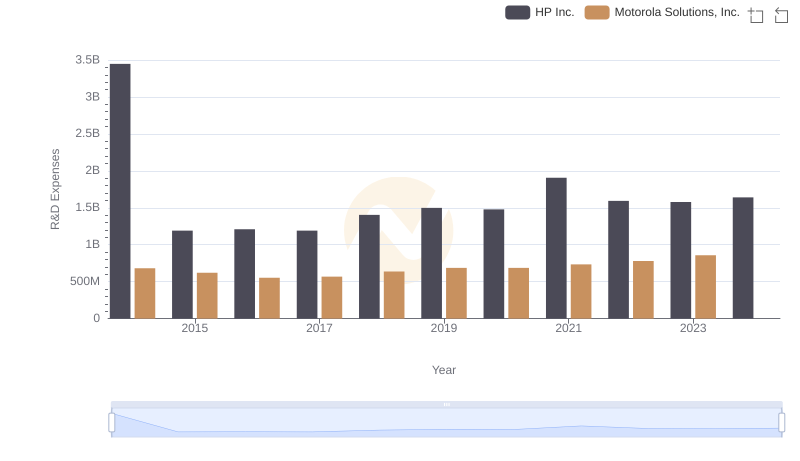
R&D Insights: How Motorola Solutions, Inc. and HP Inc. Allocate Funds
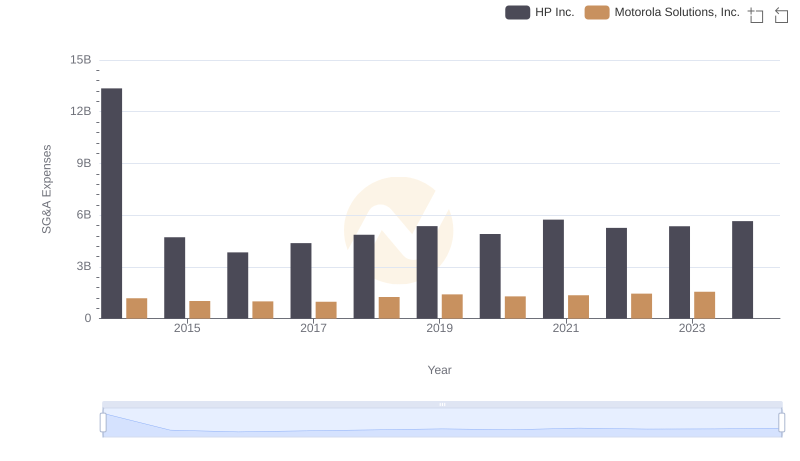
Breaking Down SG&A Expenses: Motorola Solutions, Inc. vs HP Inc.