| __timestamp | Allegion plc | Westinghouse Air Brake Technologies Corporation |
|---|---|---|
| Wednesday, January 1, 2014 | 365700000 | 588370000 |
| Thursday, January 1, 2015 | 315400000 | 672301000 |
| Friday, January 1, 2016 | 422600000 | 535893000 |
| Sunday, January 1, 2017 | 523300000 | 532795000 |
| Monday, January 1, 2018 | 617600000 | 584199000 |
| Tuesday, January 1, 2019 | 614300000 | 1067300000 |
| Wednesday, January 1, 2020 | 497700000 | 1229400000 |
| Friday, January 1, 2021 | 657300000 | 1405000000 |
| Saturday, January 1, 2022 | 688300000 | 1519000000 |
| Sunday, January 1, 2023 | 819300000 | 1787000000 |
| Monday, January 1, 2024 | 919800000 | 1609000000 |
Unlocking the unknown
In the world of industrial innovation, Westinghouse Air Brake Technologies Corporation and Allegion plc stand as titans. Over the past decade, these companies have showcased remarkable growth in their EBITDA, a key indicator of financial health. From 2014 to 2023, Westinghouse Air Brake Technologies saw its EBITDA soar by approximately 204%, reaching a peak in 2023. Allegion plc, not to be outdone, experienced a robust 124% increase over the same period.
Starting in 2014, Westinghouse Air Brake Technologies consistently outperformed Allegion plc, with a notable surge in 2019, where its EBITDA nearly doubled. Allegion plc, however, demonstrated steady growth, culminating in a significant leap in 2023. This data underscores the resilience and strategic prowess of both companies in navigating the industrial landscape.
As we look to the future, these trends highlight the potential for continued innovation and expansion in the industrial sector.
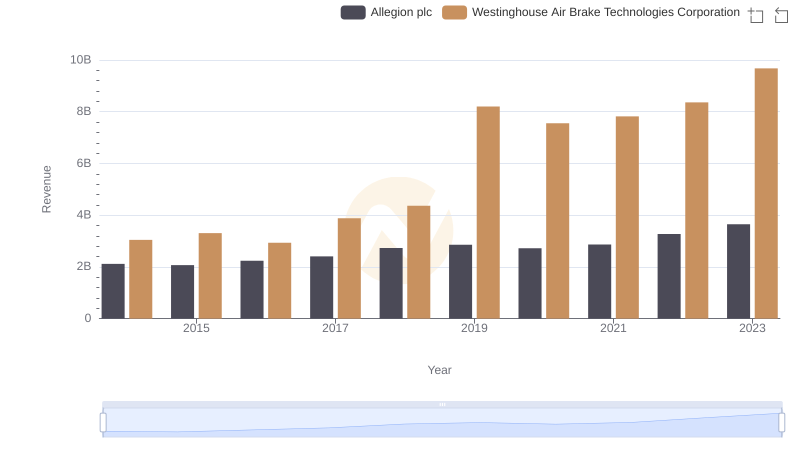
Annual Revenue Comparison: Westinghouse Air Brake Technologies Corporation vs Allegion plc
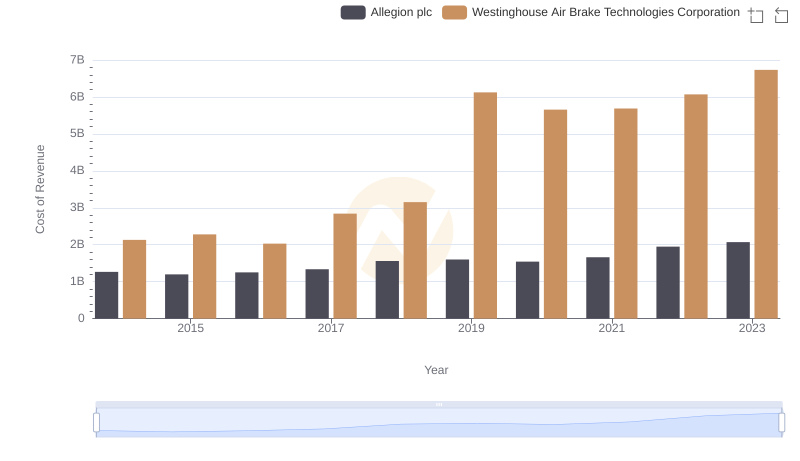
Comparing Cost of Revenue Efficiency: Westinghouse Air Brake Technologies Corporation vs Allegion plc
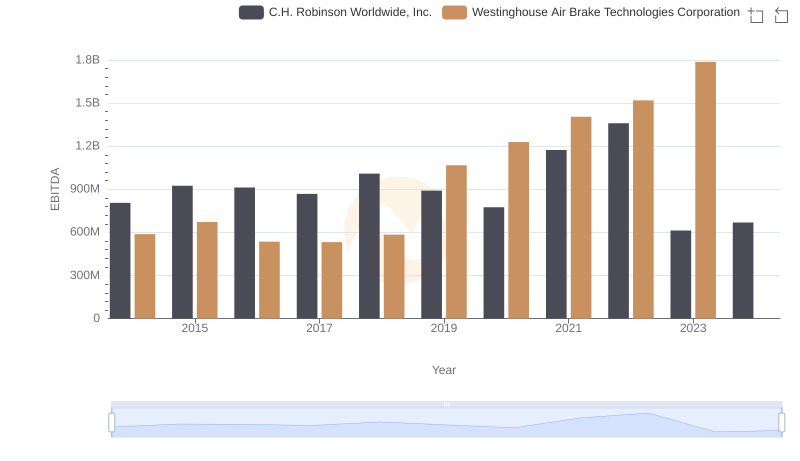
EBITDA Performance Review: Westinghouse Air Brake Technologies Corporation vs C.H. Robinson Worldwide, Inc.
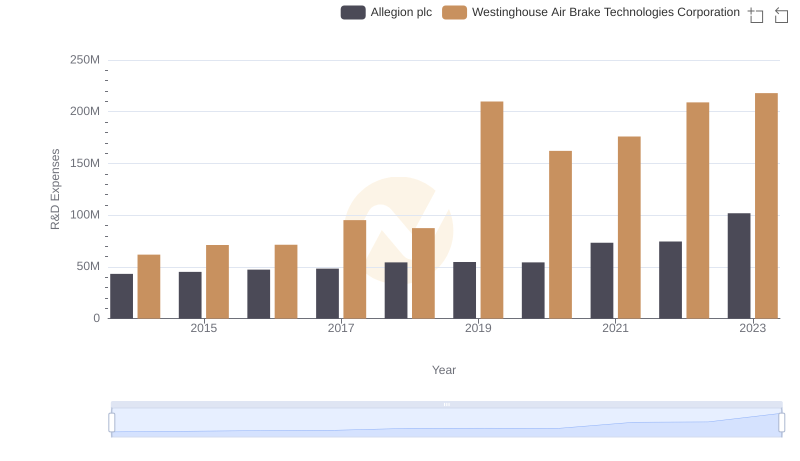
Research and Development Investment: Westinghouse Air Brake Technologies Corporation vs Allegion plc