| __timestamp | Graco Inc. | Waste Management, Inc. |
|---|---|---|
| Wednesday, January 1, 2014 | 666736000 | 4994000000 |
| Thursday, January 1, 2015 | 684700000 | 4730000000 |
| Friday, January 1, 2016 | 708239000 | 5123000000 |
| Sunday, January 1, 2017 | 793049000 | 5464000000 |
| Monday, January 1, 2018 | 882539000 | 5665000000 |
| Tuesday, January 1, 2019 | 859756000 | 5959000000 |
| Wednesday, January 1, 2020 | 854937000 | 5877000000 |
| Friday, January 1, 2021 | 1033949000 | 6820000000 |
| Saturday, January 1, 2022 | 1057439000 | 7404000000 |
| Sunday, January 1, 2023 | 1161021000 | 7820000000 |
| Monday, January 1, 2024 | 1122461000 | 8680000000 |
Igniting the spark of knowledge
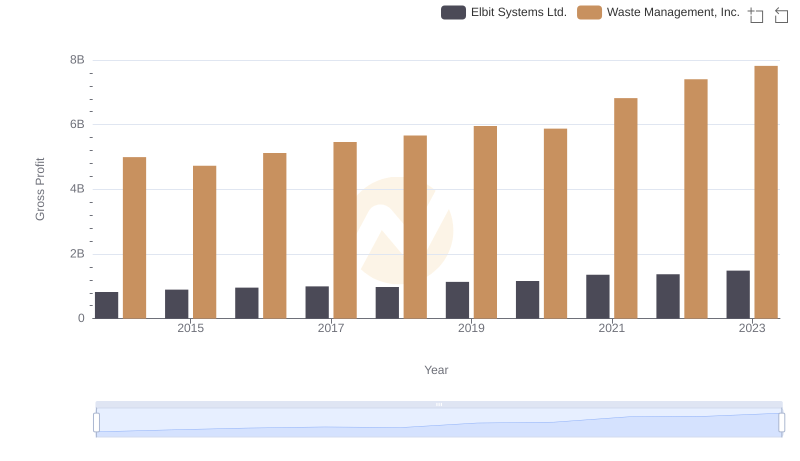
In the ever-evolving landscape of American industry, Waste Management, Inc. and Graco Inc. stand as titans in their respective fields. Over the past decade, from 2014 to 2023, these companies have showcased remarkable growth in gross profit, reflecting their strategic prowess and market adaptability. Waste Management, Inc., a leader in environmental services, has seen its gross profit soar by approximately 57%, peaking in 2023. Meanwhile, Graco Inc., a stalwart in fluid handling systems, has experienced a robust 74% increase, reaching its zenith in 2023. This comparison highlights the resilience and innovation driving these companies forward. Notably, the data for 2024 is incomplete, leaving room for speculation on future trajectories. As these giants continue to navigate economic challenges, their financial performance remains a testament to their enduring market influence.
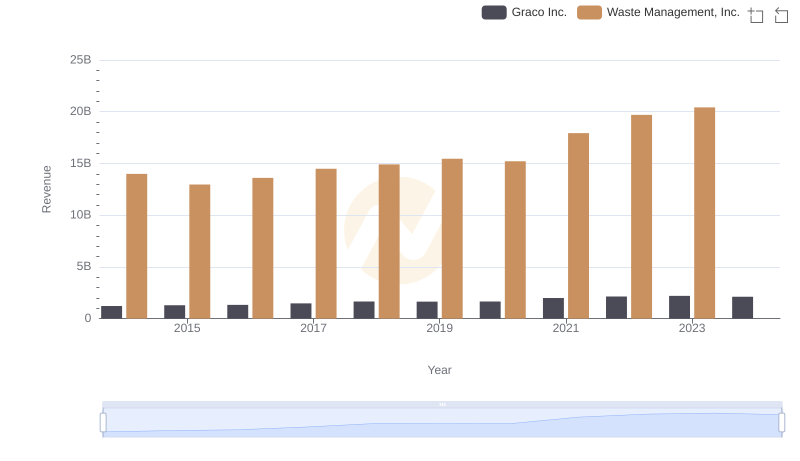
Annual Revenue Comparison: Waste Management, Inc. vs Graco Inc.
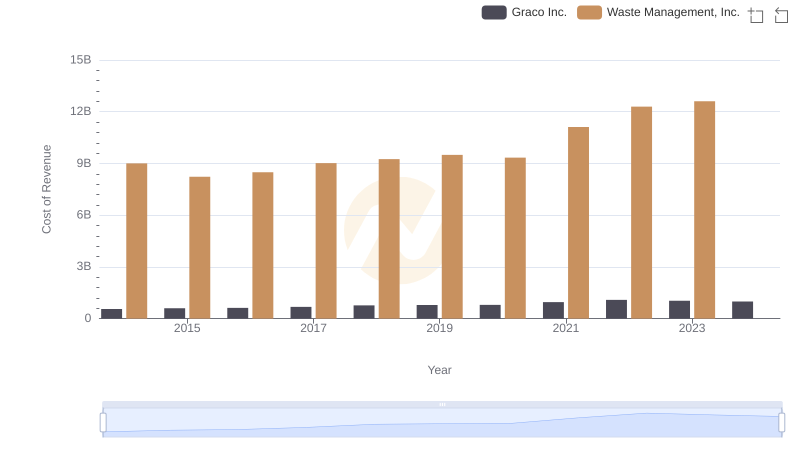
Cost Insights: Breaking Down Waste Management, Inc. and Graco Inc.'s Expenses
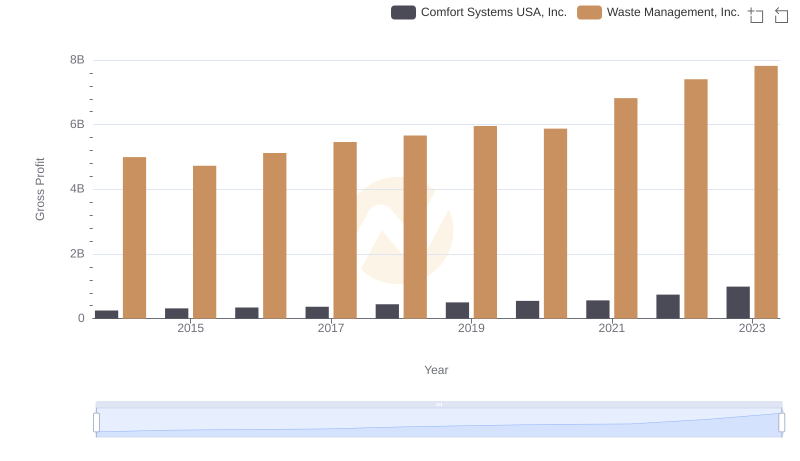
Who Generates Higher Gross Profit? Waste Management, Inc. or Comfort Systems USA, Inc.
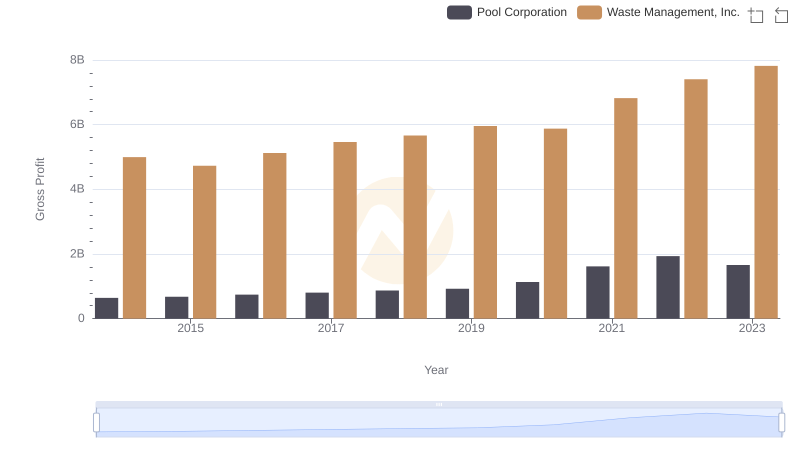
Gross Profit Comparison: Waste Management, Inc. and Pool Corporation Trends
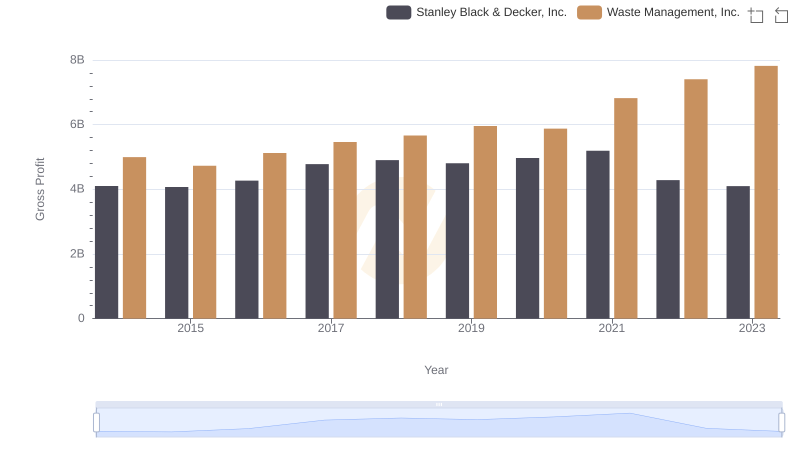
Gross Profit Analysis: Comparing Waste Management, Inc. and Stanley Black & Decker, Inc.
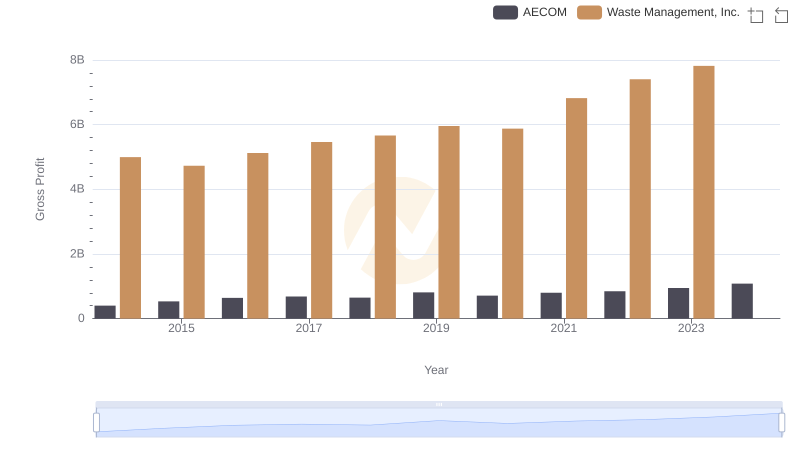
Waste Management, Inc. vs AECOM: A Gross Profit Performance Breakdown
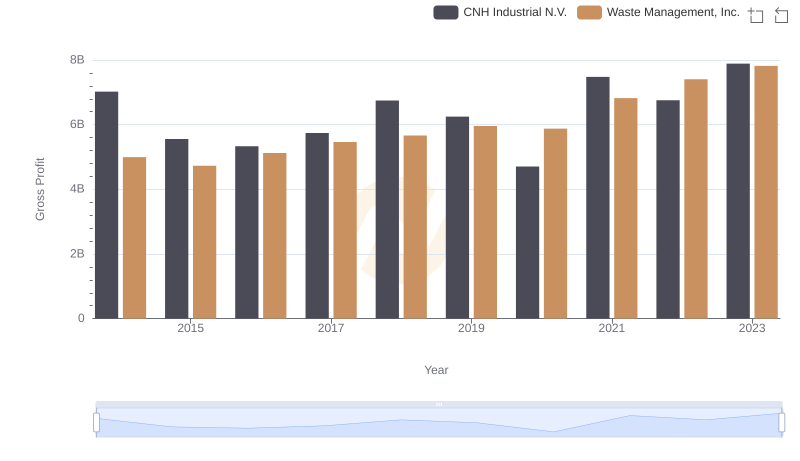
Gross Profit Trends Compared: Waste Management, Inc. vs CNH Industrial N.V.
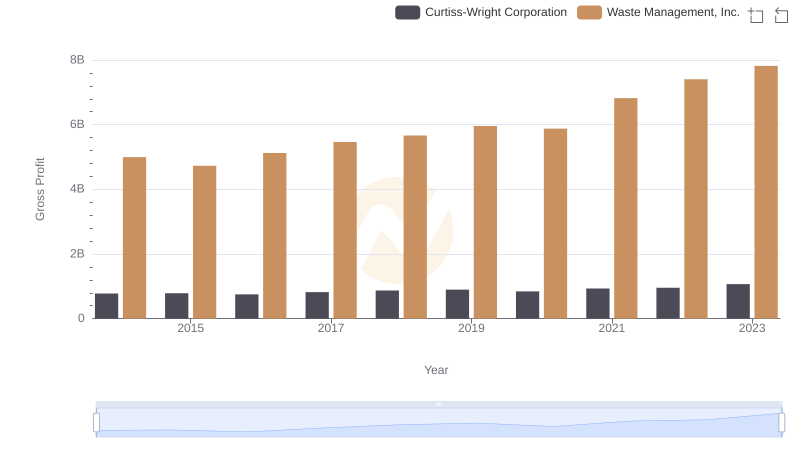
Key Insights on Gross Profit: Waste Management, Inc. vs Curtiss-Wright Corporation
Key Insights on Gross Profit: Waste Management, Inc. vs Elbit Systems Ltd.

Waste Management, Inc. and Graco Inc.: A Detailed Examination of EBITDA Performance