| __timestamp | Automatic Data Processing, Inc. | Ferguson plc |
|---|---|---|
| Wednesday, January 1, 2014 | 11832800000 | 22198928094 |
| Thursday, January 1, 2015 | 10560800000 | 20800698973 |
| Friday, January 1, 2016 | 11290500000 | 19066872795 |
| Sunday, January 1, 2017 | 11982400000 | 20009463224 |
| Monday, January 1, 2018 | 12859300000 | 20752000000 |
| Tuesday, January 1, 2019 | 13613300000 | 22010000000 |
| Wednesday, January 1, 2020 | 14589800000 | 21819000000 |
| Friday, January 1, 2021 | 15005400000 | 22792000000 |
| Saturday, January 1, 2022 | 16498300000 | 28566000000 |
| Sunday, January 1, 2023 | 18012200000 | 29734000000 |
| Monday, January 1, 2024 | 19202600000 | 29635000000 |
Unleashing the power of data
In the ever-evolving landscape of global business, Automatic Data Processing, Inc. (ADP) and Ferguson plc have emerged as formidable players. Over the past decade, from 2014 to 2024, these companies have demonstrated remarkable revenue growth, reflecting their strategic prowess and market adaptability.
ADP, a leader in human capital management, has seen its revenue grow by approximately 62% over this period. Starting at around $11.8 billion in 2014, it reached nearly $19.2 billion by 2024. This consistent upward trajectory underscores ADP's ability to innovate and expand its service offerings.
Meanwhile, Ferguson plc, a major distributor of plumbing and heating products, has experienced a 34% increase in revenue, from $22.2 billion in 2014 to $29.6 billion in 2024. Ferguson's growth highlights its strategic acquisitions and expansion into new markets.
These trends not only showcase the resilience of these companies but also provide valuable insights into their strategic directions.

Automatic Data Processing, Inc. vs Verisk Analytics, Inc.: Examining Key Revenue Metrics

Breaking Down Revenue Trends: Automatic Data Processing, Inc. vs Westinghouse Air Brake Technologies Corporation
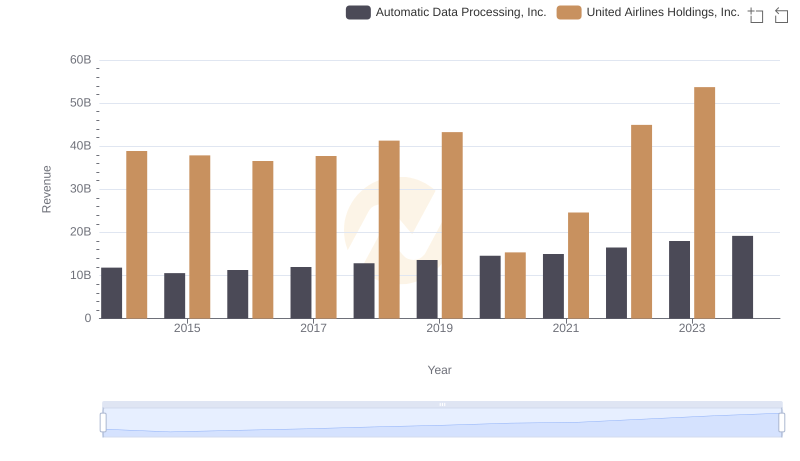
Automatic Data Processing, Inc. vs United Airlines Holdings, Inc.: Examining Key Revenue Metrics
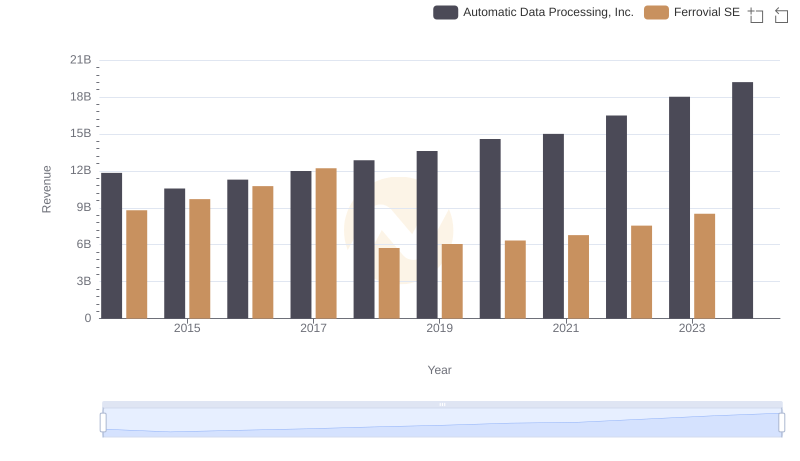
Revenue Insights: Automatic Data Processing, Inc. and Ferrovial SE Performance Compared
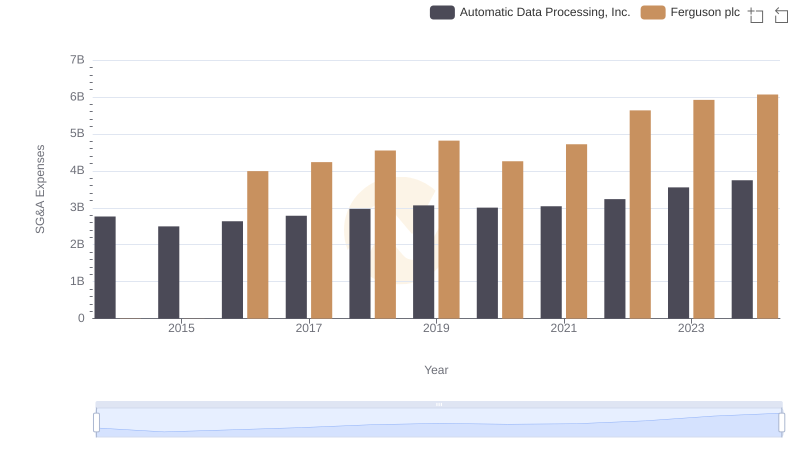
Who Optimizes SG&A Costs Better? Automatic Data Processing, Inc. or Ferguson plc