| __timestamp | Eaton Corporation plc | Rockwell Automation, Inc. |
|---|---|---|
| Wednesday, January 1, 2014 | 15646000000 | 3869600000 |
| Thursday, January 1, 2015 | 14292000000 | 3604800000 |
| Friday, January 1, 2016 | 13400000000 | 3404000000 |
| Sunday, January 1, 2017 | 13756000000 | 3687100000 |
| Monday, January 1, 2018 | 14511000000 | 3793800000 |
| Tuesday, January 1, 2019 | 14338000000 | 3794700000 |
| Wednesday, January 1, 2020 | 12408000000 | 3734600000 |
| Friday, January 1, 2021 | 13293000000 | 4099700000 |
| Saturday, January 1, 2022 | 13865000000 | 4658400000 |
| Sunday, January 1, 2023 | 14763000000 | 5341000000 |
| Monday, January 1, 2024 | 15375000000 | 5070800000 |
Igniting the spark of knowledge
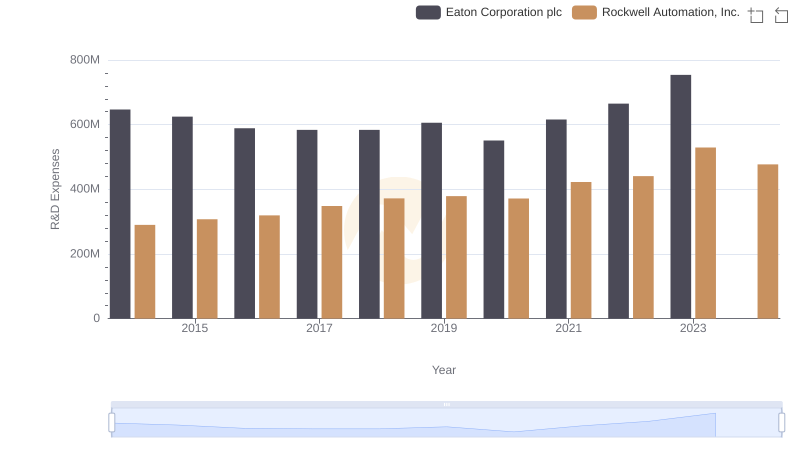
In the competitive landscape of industrial automation, Eaton Corporation plc and Rockwell Automation, Inc. have been pivotal players. Over the past decade, Eaton's cost of revenue has consistently outpaced Rockwell's, averaging around 3.4 times higher. This trend highlights Eaton's expansive operations and broader market reach.
From 2014 to 2023, Eaton's cost of revenue peaked in 2014 at approximately $15.6 billion, while Rockwell's highest was in 2023, reaching about $5.3 billion. Notably, Eaton experienced a dip in 2020, likely due to global economic disruptions, but rebounded by 2023. Rockwell, on the other hand, showed a steady increase, reflecting its strategic growth initiatives.
As we move into 2024, Rockwell's data is available, but Eaton's is missing, leaving room for speculation on its future trajectory. This comparison underscores the dynamic nature of the industrial sector and the strategic maneuvers of these industry leaders.