| __timestamp | Canadian National Railway Company | Quanta Services, Inc. |
|---|---|---|
| Wednesday, January 1, 2014 | 7142000000 | 6617730000 |
| Thursday, January 1, 2015 | 6951000000 | 6648771000 |
| Friday, January 1, 2016 | 6362000000 | 6637519000 |
| Sunday, January 1, 2017 | 7366000000 | 8224618000 |
| Monday, January 1, 2018 | 8359000000 | 9691459000 |
| Tuesday, January 1, 2019 | 8832000000 | 10511901000 |
| Wednesday, January 1, 2020 | 8048000000 | 9541825000 |
| Friday, January 1, 2021 | 8408000000 | 11026954000 |
| Saturday, January 1, 2022 | 9711000000 | 14544748000 |
| Sunday, January 1, 2023 | 9677000000 | 17945120000 |
In pursuit of knowledge
In the ever-evolving landscape of North American industries, the cost of revenue is a critical metric for understanding operational efficiency. Over the past decade, Canadian National Railway Company and Quanta Services, Inc. have shown distinct trends in their cost of revenue. From 2014 to 2023, Canadian National Railway's cost of revenue increased by approximately 35%, peaking in 2022. Meanwhile, Quanta Services experienced a staggering 171% rise, reflecting its aggressive expansion and adaptation to market demands. Notably, Quanta Services surpassed Canadian National Railway in 2017 and continued to widen the gap, reaching nearly double the cost of revenue by 2023. These insights highlight the dynamic nature of these industries and the strategic decisions driving their financial trajectories. As we look to the future, understanding these trends will be crucial for investors and stakeholders aiming to navigate the complexities of the market.

Cost of Revenue: Key Insights for Canadian National Railway Company and Axon Enterprise, Inc.

Revenue Showdown: Canadian National Railway Company vs Quanta Services, Inc.
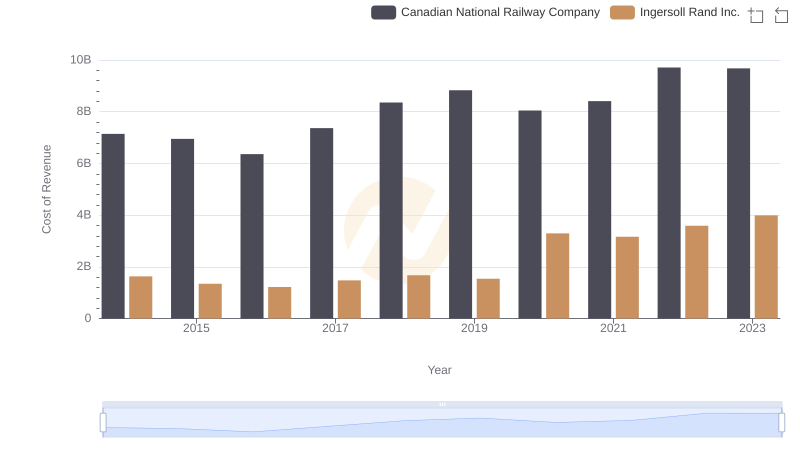
Analyzing Cost of Revenue: Canadian National Railway Company and Ingersoll Rand Inc.
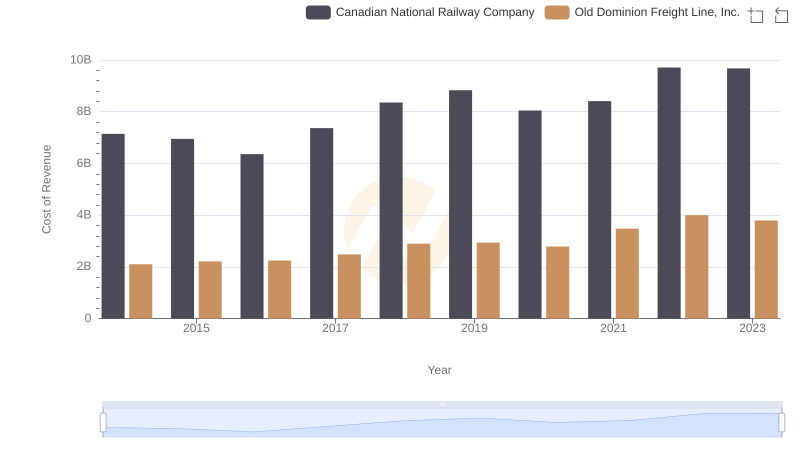
Cost Insights: Breaking Down Canadian National Railway Company and Old Dominion Freight Line, Inc.'s Expenses