| __timestamp | Infosys Limited | PTC Inc. |
|---|---|---|
| Wednesday, January 1, 2014 | 5374000000 | 373683000 |
| Thursday, January 1, 2015 | 5950000000 | 334734000 |
| Friday, January 1, 2016 | 6446000000 | 325665000 |
| Sunday, January 1, 2017 | 7001000000 | 329019000 |
| Monday, January 1, 2018 | 7687000000 | 326194000 |
| Tuesday, January 1, 2019 | 8552000000 | 325378000 |
| Wednesday, January 1, 2020 | 8828000000 | 334271000 |
| Friday, January 1, 2021 | 10996000000 | 371102000 |
| Saturday, January 1, 2022 | 12709000000 | 385980000 |
| Sunday, January 1, 2023 | 13096000000 | 441006000 |
| Monday, January 1, 2024 | 486834000 |
Infusing magic into the data realm
In the ever-evolving landscape of global technology, Infosys Limited and PTC Inc. stand as prominent players, each with its unique trajectory. From 2014 to 2023, Infosys Limited has seen a remarkable growth in its cost of revenue, surging by over 140%, reflecting its expanding operations and market reach. In contrast, PTC Inc. has maintained a more stable cost structure, with a modest increase of around 18% over the same period.
Infosys's cost of revenue peaked in 2023, reaching approximately 13 billion, while PTC Inc. recorded its highest in 2024, with nearly 487 million. This disparity highlights the scale and operational differences between the two companies. The data for 2024 is incomplete for Infosys, indicating potential future insights yet to be uncovered. As these companies continue to innovate, their financial strategies will be crucial in shaping their competitive edge.
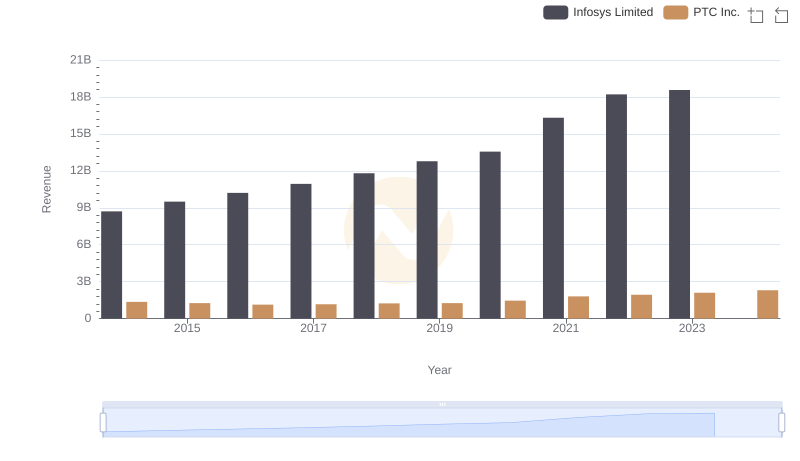
Who Generates More Revenue? Infosys Limited or PTC Inc.

Analyzing Cost of Revenue: Infosys Limited and Ubiquiti Inc.
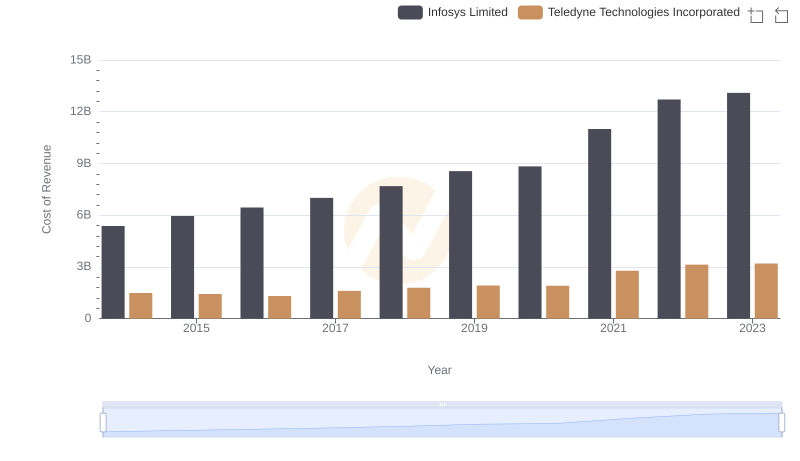
Infosys Limited vs Teledyne Technologies Incorporated: Efficiency in Cost of Revenue Explored
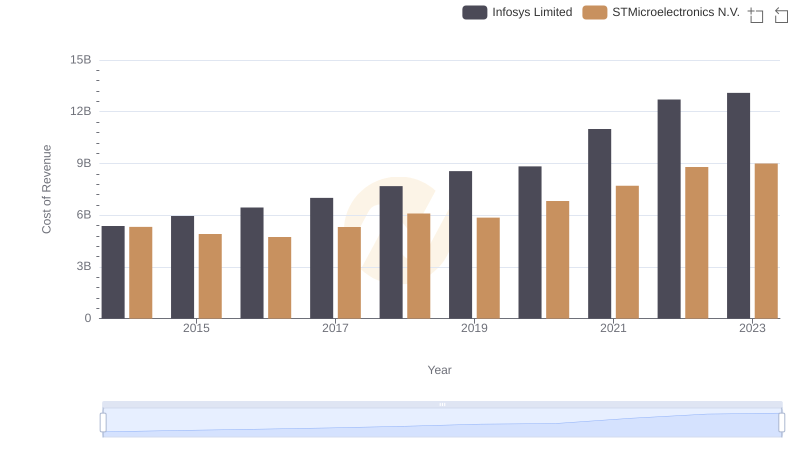
Infosys Limited vs STMicroelectronics N.V.: Efficiency in Cost of Revenue Explored
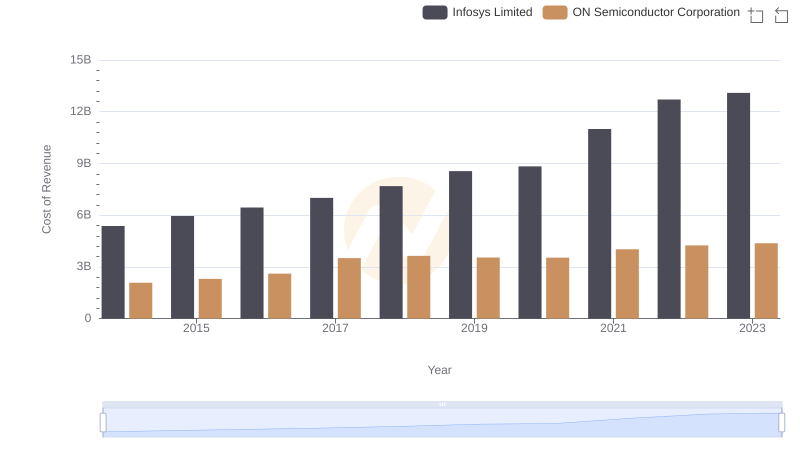
Cost of Revenue: Key Insights for Infosys Limited and ON Semiconductor Corporation
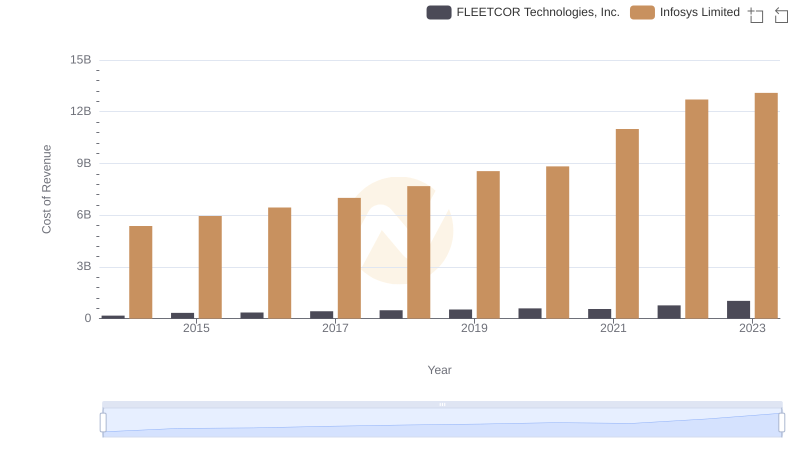
Comparing Cost of Revenue Efficiency: Infosys Limited vs FLEETCOR Technologies, Inc.
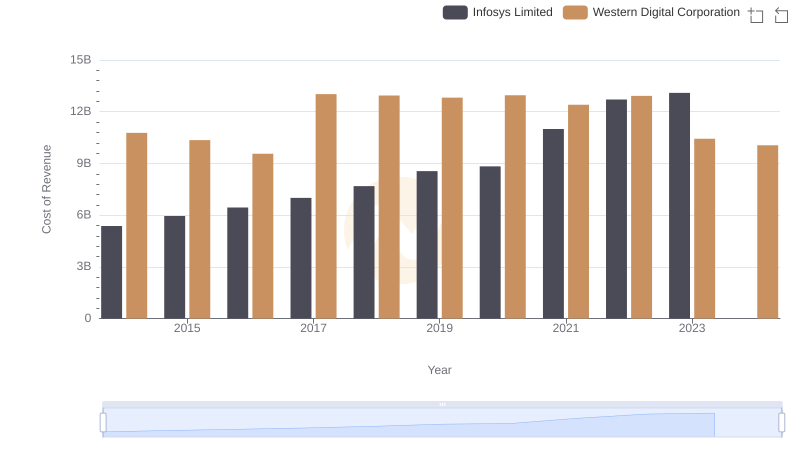
Cost Insights: Breaking Down Infosys Limited and Western Digital Corporation's Expenses
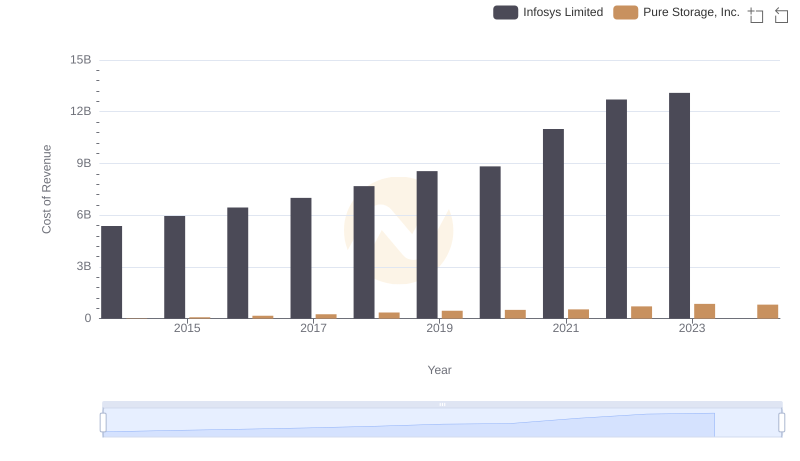
Analyzing Cost of Revenue: Infosys Limited and Pure Storage, Inc.

Infosys Limited vs PTC Inc.: A Gross Profit Performance Breakdown
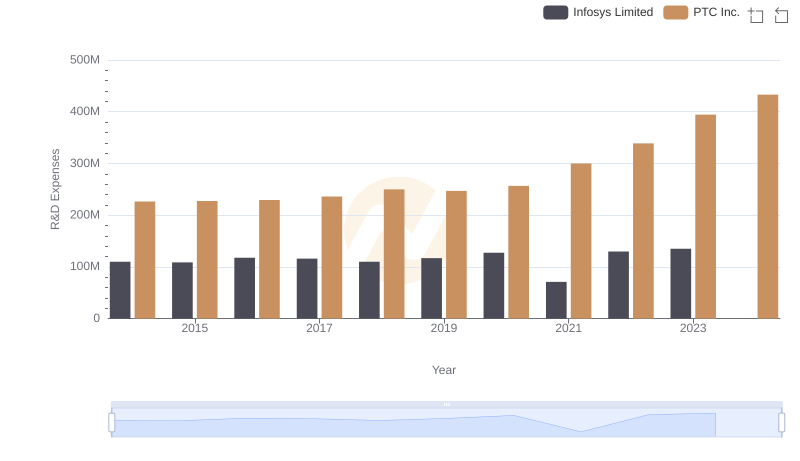
Research and Development: Comparing Key Metrics for Infosys Limited and PTC Inc.
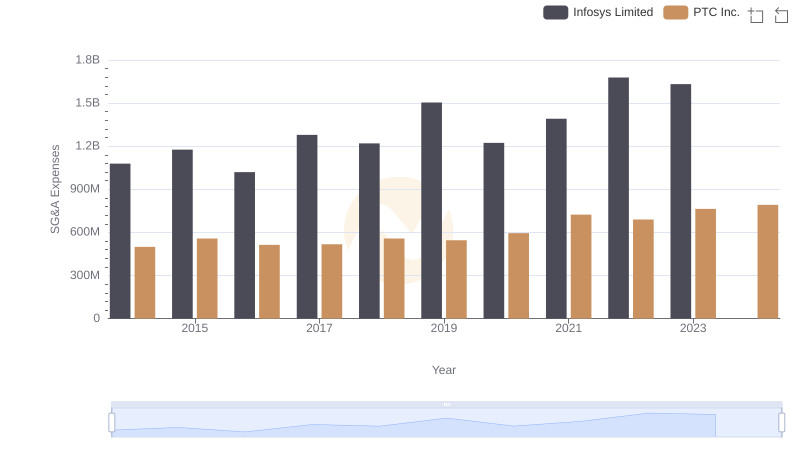
Infosys Limited or PTC Inc.: Who Manages SG&A Costs Better?
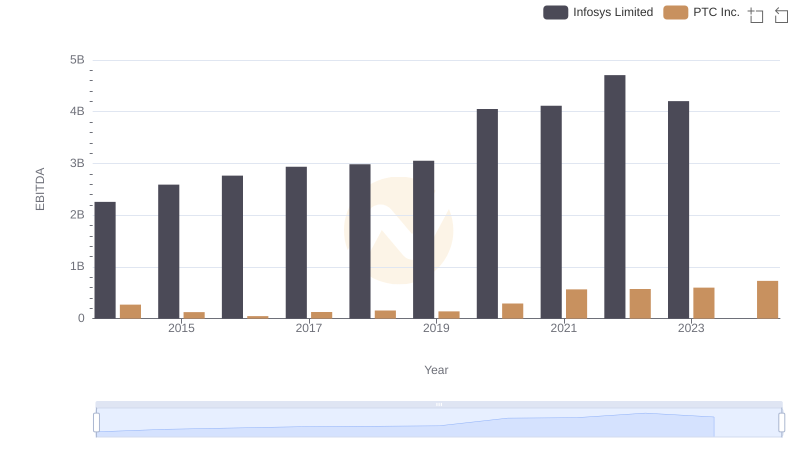
A Side-by-Side Analysis of EBITDA: Infosys Limited and PTC Inc.