| __timestamp | Equifax Inc. | Rentokil Initial plc |
|---|---|---|
| Wednesday, January 1, 2014 | 842400000 | 410400000 |
| Thursday, January 1, 2015 | 914600000 | 408700000 |
| Friday, January 1, 2016 | 1116900000 | 489000000 |
| Sunday, January 1, 2017 | 1013900000 | 503200000 |
| Monday, January 1, 2018 | 770200000 | 149800000 |
| Tuesday, January 1, 2019 | 29000000 | 580600000 |
| Wednesday, January 1, 2020 | 1217800000 | 581000000 |
| Friday, January 1, 2021 | 1575200000 | 656000000 |
| Saturday, January 1, 2022 | 1672800000 | 767000000 |
| Sunday, January 1, 2023 | 1579100000 | 1157000000 |
| Monday, January 1, 2024 | 1251200000 |
Unlocking the unknown
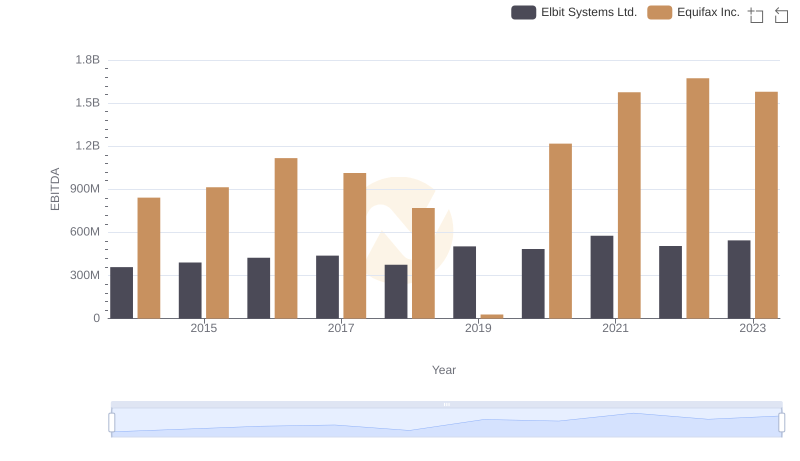
In the ever-evolving landscape of global business, understanding the financial health of companies is crucial. This analysis delves into the EBITDA performance of Equifax Inc. and Rentokil Initial plc from 2014 to 2023. Over this period, Equifax Inc. demonstrated a robust growth trajectory, with EBITDA peaking in 2022 at approximately 1.67 billion, marking a 98% increase from 2014. In contrast, Rentokil Initial plc showed a steady rise, culminating in a 182% increase by 2023, reaching around 1.16 billion.
The data reveals a significant dip for Equifax in 2019, with EBITDA plummeting to just 29 million, likely due to external challenges. However, the company rebounded strongly in subsequent years. Rentokil's consistent growth underscores its resilience and strategic market positioning. This comparative analysis highlights the dynamic nature of financial performance and the importance of strategic adaptability in maintaining competitive advantage.