| __timestamp | Owens Corning | Union Pacific Corporation |
|---|---|---|
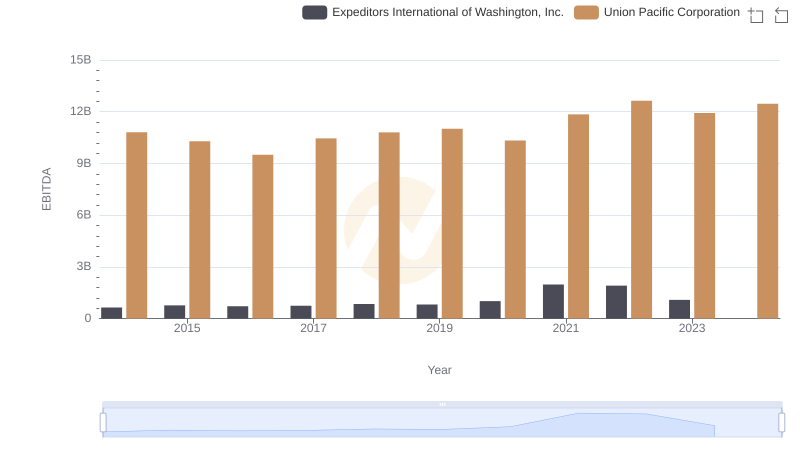
| Wednesday, January 1, 2014 | 650000000 | 10808000000 |
| Thursday, January 1, 2015 | 853000000 | 10290000000 |
| Friday, January 1, 2016 | 1041000000 | 9502000000 |
| Sunday, January 1, 2017 | 1134000000 | 10456000000 |
| Monday, January 1, 2018 | 1266000000 | 10802000000 |
| Tuesday, January 1, 2019 | 1178000000 | 11013000000 |
| Wednesday, January 1, 2020 | 341000000 | 10331000000 |
| Friday, January 1, 2021 | 1909000000 | 11843000000 |
| Saturday, January 1, 2022 | 2200000000 | 12636000000 |
| Sunday, January 1, 2023 | 2166000000 | 11928000000 |
| Monday, January 1, 2024 | 12461000000 |
Unlocking the unknown
In the world of corporate finance, EBITDA (Earnings Before Interest, Taxes, Depreciation, and Amortization) serves as a crucial indicator of a company's operational performance. This analysis compares the EBITDA of Union Pacific Corporation and Owens Corning from 2014 to 2023. Over this period, Union Pacific consistently outperformed Owens Corning, with its EBITDA peaking at approximately $12.6 billion in 2022, a 33% increase from its 2016 low. In contrast, Owens Corning's EBITDA saw a significant rise, reaching its zenith in 2022 with a 540% increase from its 2020 low. Notably, 2020 was a challenging year for Owens Corning, with EBITDA dropping to $341 million, likely due to the global economic downturn. The data for 2024 is incomplete, highlighting the need for ongoing analysis to capture future trends. This comparison underscores the resilience and growth potential of these industry giants.