| __timestamp | HubSpot, Inc. | Workday, Inc. |
|---|---|---|
| Wednesday, January 1, 2014 | 78796000 | 292128000 |
| Thursday, January 1, 2015 | 134020000 | 523057000 |
| Friday, January 1, 2016 | 209102000 | 787919000 |
| Sunday, January 1, 2017 | 299883000 | 1085862000 |
| Monday, January 1, 2018 | 412623000 | 1513637000 |
| Tuesday, January 1, 2019 | 544902000 | 1987230000 |
| Wednesday, January 1, 2020 | 716067000 | 2561948000 |
| Friday, January 1, 2021 | 1041801000 | 3119864000 |
| Saturday, January 1, 2022 | 1416710000 | 3710703000 |
| Sunday, January 1, 2023 | 1824741000 | 4500640000 |
| Monday, January 1, 2024 | 2234278000 | 5488000000 |
Infusing magic into the data realm
In the ever-evolving landscape of enterprise software, Workday, Inc. and HubSpot, Inc. have emerged as formidable players. Since 2014, both companies have demonstrated impressive growth in gross profit, reflecting their strategic prowess and market adaptability. Workday's gross profit surged from approximately $292 million in 2014 to a staggering $4.5 billion by 2023, marking an increase of over 1,400%. Meanwhile, HubSpot's journey from $79 million to $1.8 billion in the same period showcases a remarkable 2,200% growth.
As we look to the future, the missing data for 2024 suggests an opportunity for further analysis and anticipation of these companies' next moves.
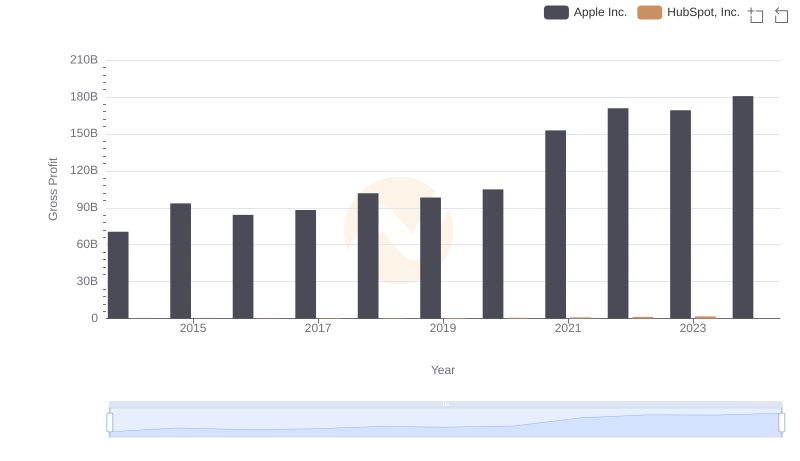
Apple Inc. and HubSpot, Inc.: A Detailed Gross Profit Analysis
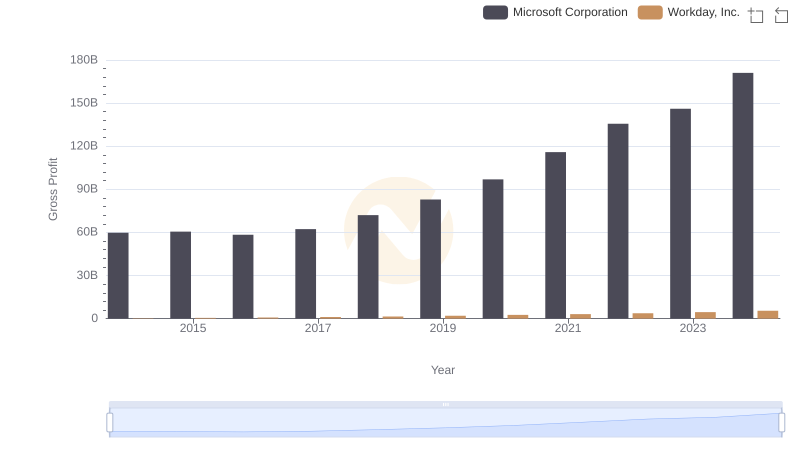
Gross Profit Trends Compared: Microsoft Corporation vs Workday, Inc.
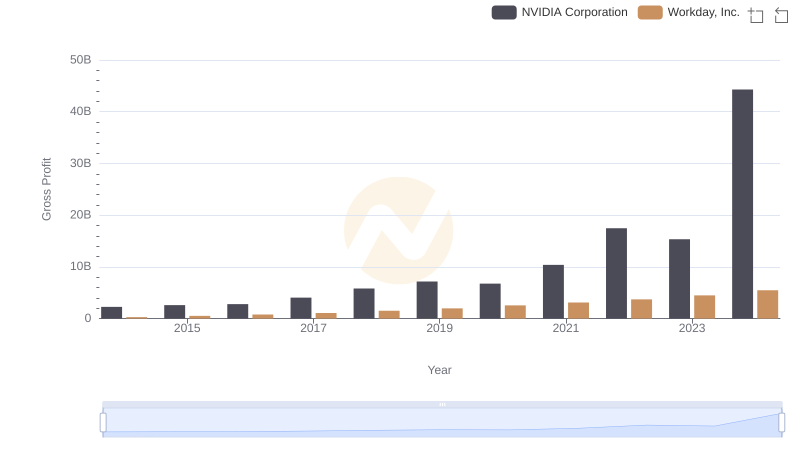
Gross Profit Analysis: Comparing NVIDIA Corporation and Workday, Inc.
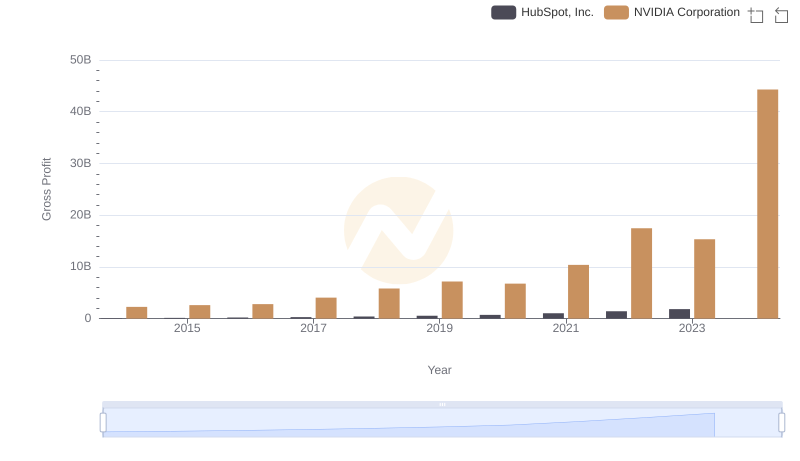
NVIDIA Corporation and HubSpot, Inc.: A Detailed Gross Profit Analysis
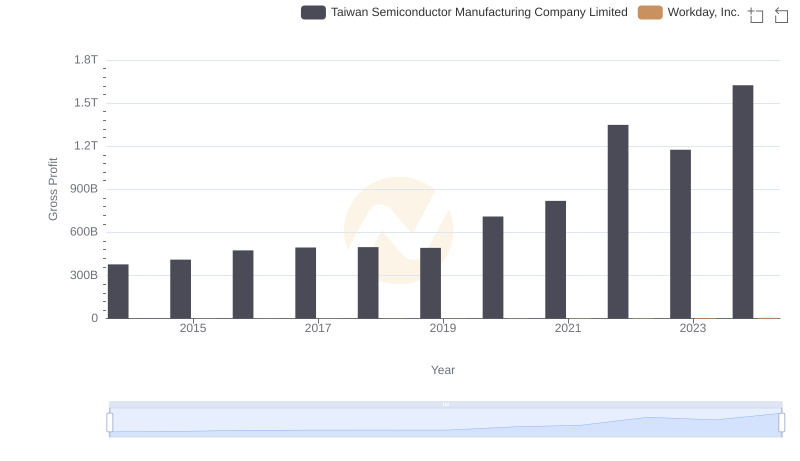
Who Generates Higher Gross Profit? Taiwan Semiconductor Manufacturing Company Limited or Workday, Inc.
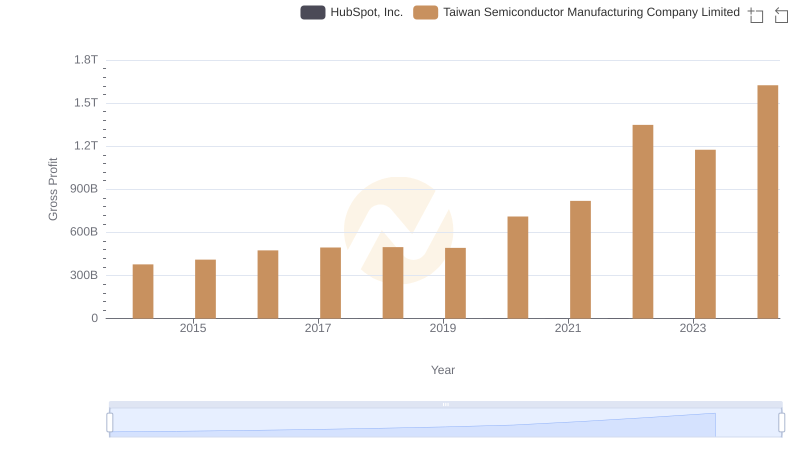
Gross Profit Trends Compared: Taiwan Semiconductor Manufacturing Company Limited vs HubSpot, Inc.
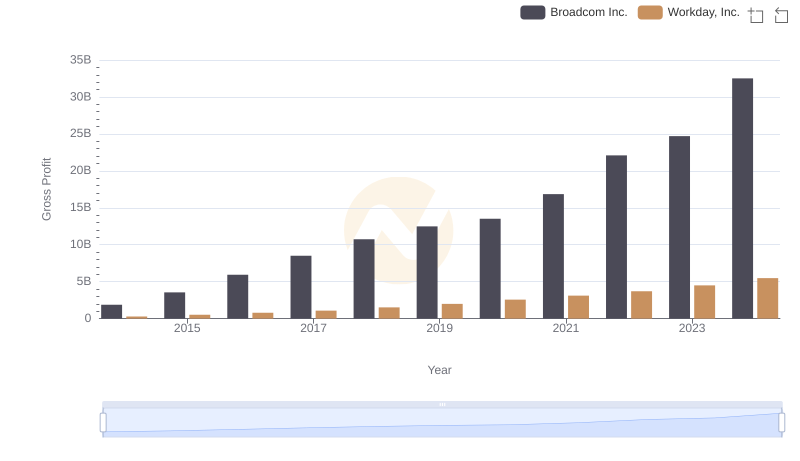
Key Insights on Gross Profit: Broadcom Inc. vs Workday, Inc.
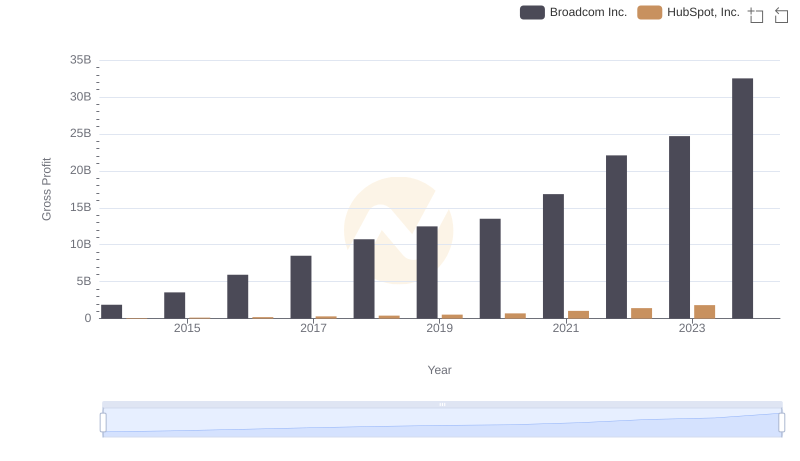
Broadcom Inc. vs HubSpot, Inc.: A Gross Profit Performance Breakdown
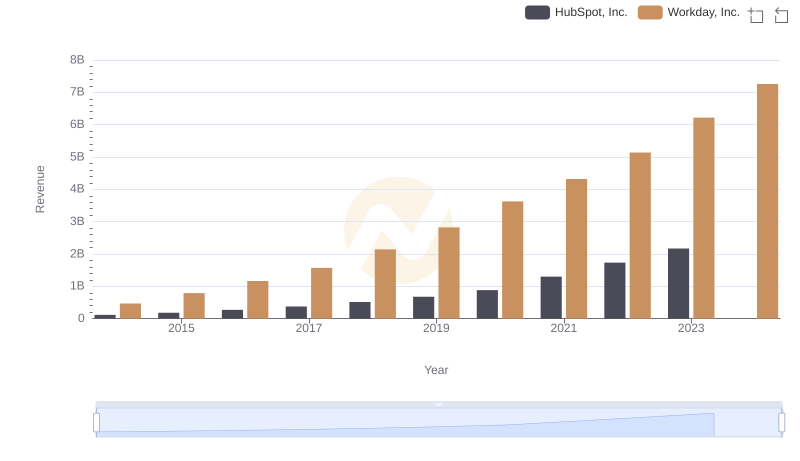
Breaking Down Revenue Trends: Workday, Inc. vs HubSpot, Inc.
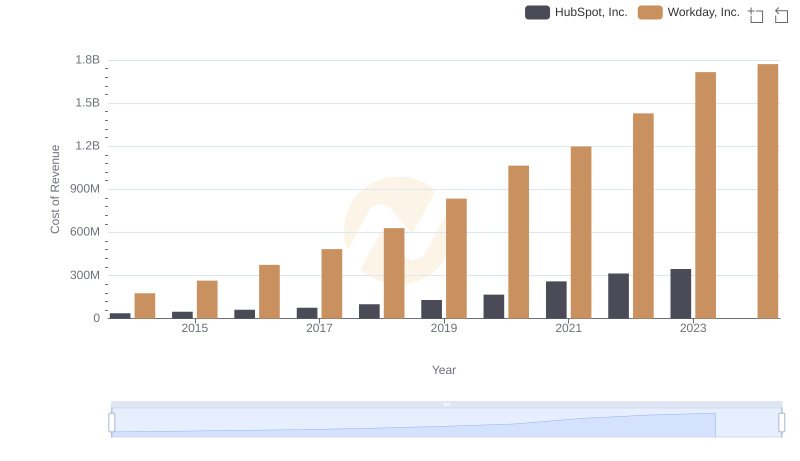
Cost Insights: Breaking Down Workday, Inc. and HubSpot, Inc.'s Expenses
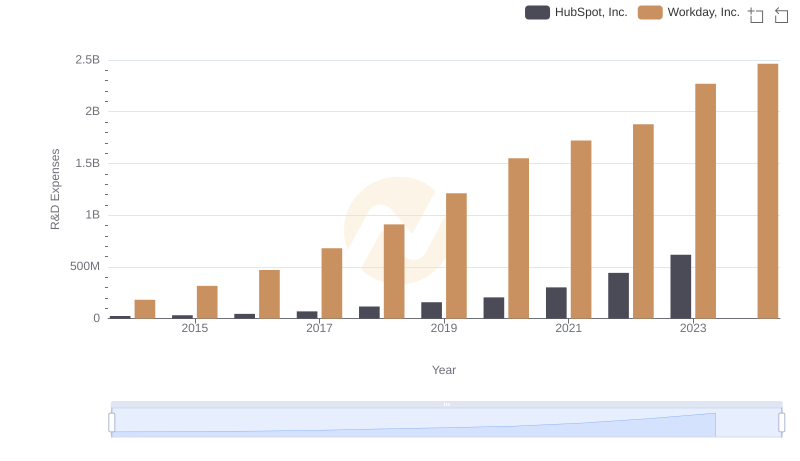
Analyzing R&D Budgets: Workday, Inc. vs HubSpot, Inc.
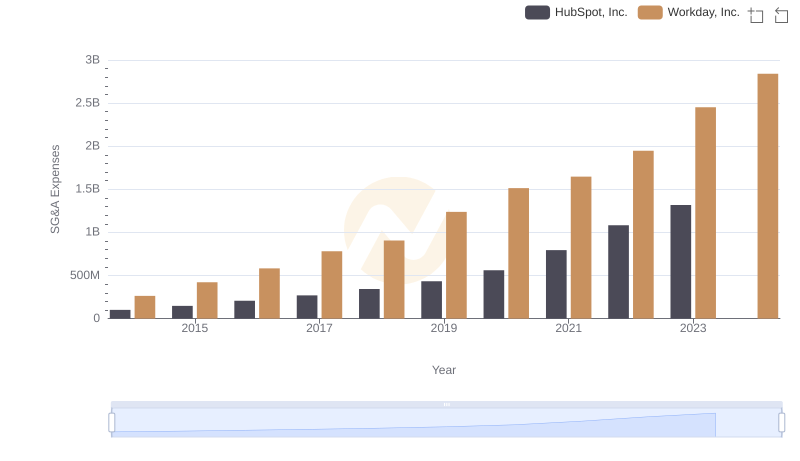
Operational Costs Compared: SG&A Analysis of Workday, Inc. and HubSpot, Inc.