| __timestamp | HubSpot, Inc. | Workday, Inc. |
|---|---|---|
| Wednesday, January 1, 2014 | 37080000 | 176810000 |
| Thursday, January 1, 2015 | 47923000 | 264803000 |
| Friday, January 1, 2016 | 61865000 | 374427000 |
| Sunday, January 1, 2017 | 75729000 | 483545000 |
| Monday, January 1, 2018 | 100357000 | 629413000 |
| Tuesday, January 1, 2019 | 129958000 | 834950000 |
| Wednesday, January 1, 2020 | 166959000 | 1065258000 |
| Friday, January 1, 2021 | 258857000 | 1198132000 |
| Saturday, January 1, 2022 | 314259000 | 1428095000 |
| Sunday, January 1, 2023 | 345489000 | 1715178000 |
| Monday, January 1, 2024 | 393265000 | 1771000000 |
Unleashing insights
In the ever-evolving landscape of enterprise software, understanding cost structures is pivotal. Over the past decade, Workday, Inc. and HubSpot, Inc. have demonstrated distinct trajectories in their cost of revenue. From 2014 to 2023, HubSpot's cost of revenue surged by nearly 830%, reflecting its aggressive growth strategy. Meanwhile, Workday's expenses increased by approximately 870%, underscoring its expansive market reach.
Starting in 2014, HubSpot's cost of revenue was a modest 37 million, while Workday's was 177 million. Fast forward to 2023, and these figures have ballooned to 345 million and 1.715 billion, respectively. This growth highlights the companies' commitment to scaling operations and enhancing service delivery.
While Workday's 2024 data is available, HubSpot's is notably absent, leaving room for speculation on its future cost trajectory.
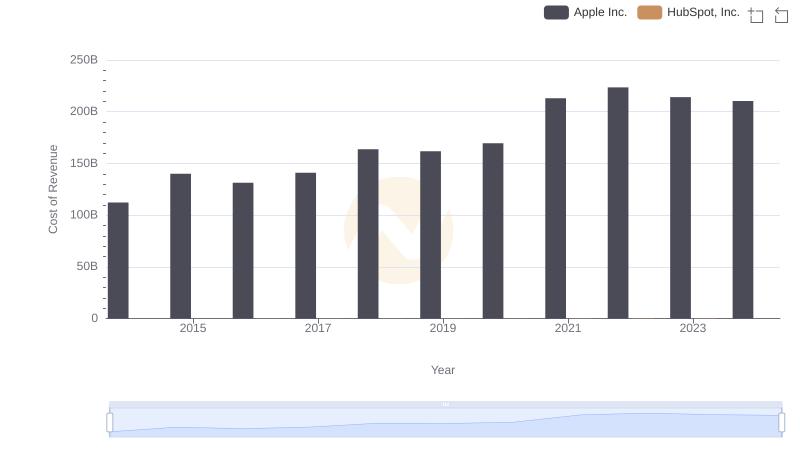
Apple Inc. vs HubSpot, Inc.: Efficiency in Cost of Revenue Explored
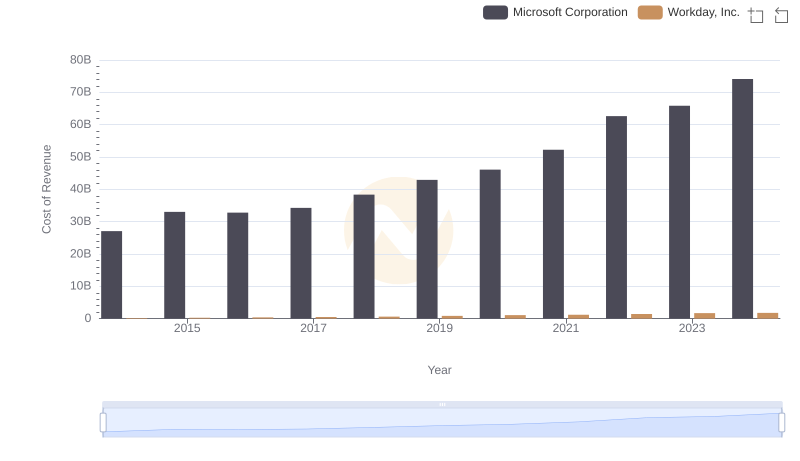
Comparing Cost of Revenue Efficiency: Microsoft Corporation vs Workday, Inc.
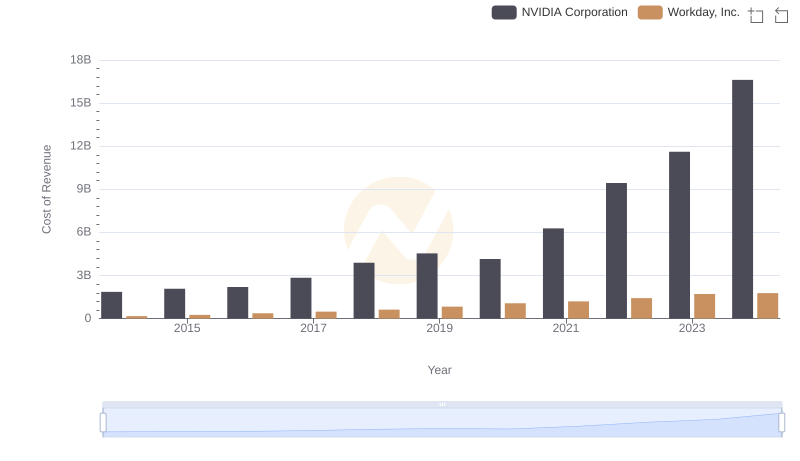
Cost of Revenue: Key Insights for NVIDIA Corporation and Workday, Inc.
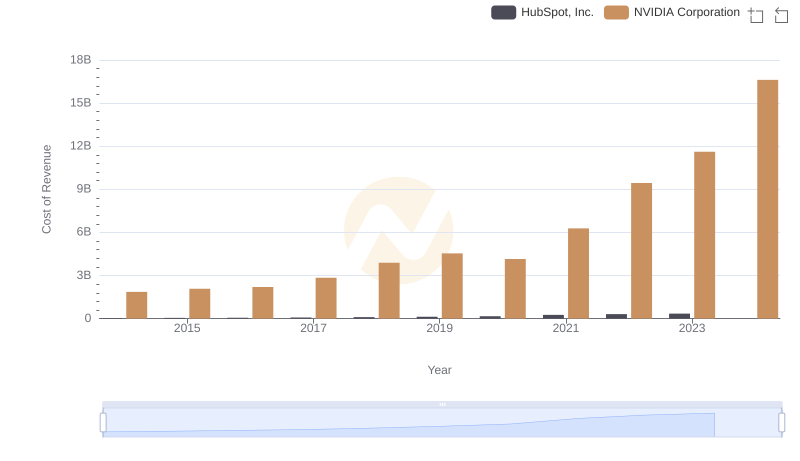
Comparing Cost of Revenue Efficiency: NVIDIA Corporation vs HubSpot, Inc.
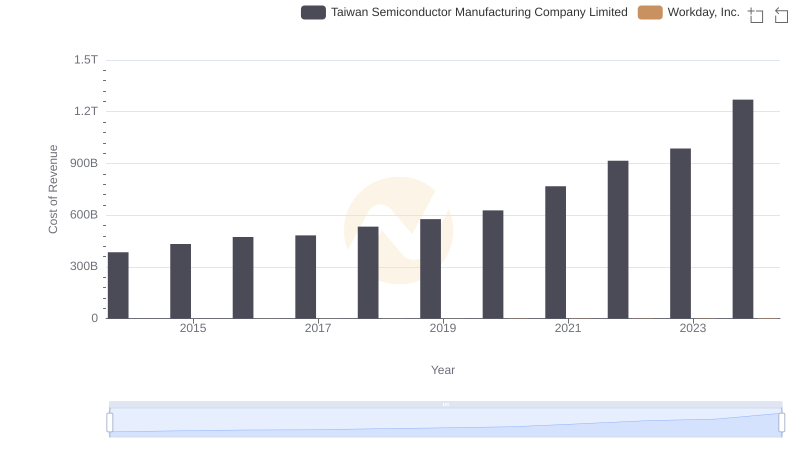
Cost of Revenue Trends: Taiwan Semiconductor Manufacturing Company Limited vs Workday, Inc.
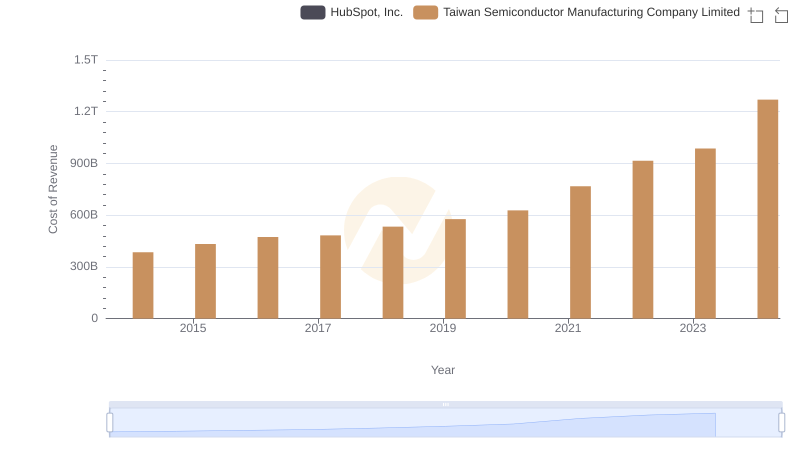
Cost of Revenue Comparison: Taiwan Semiconductor Manufacturing Company Limited vs HubSpot, Inc.
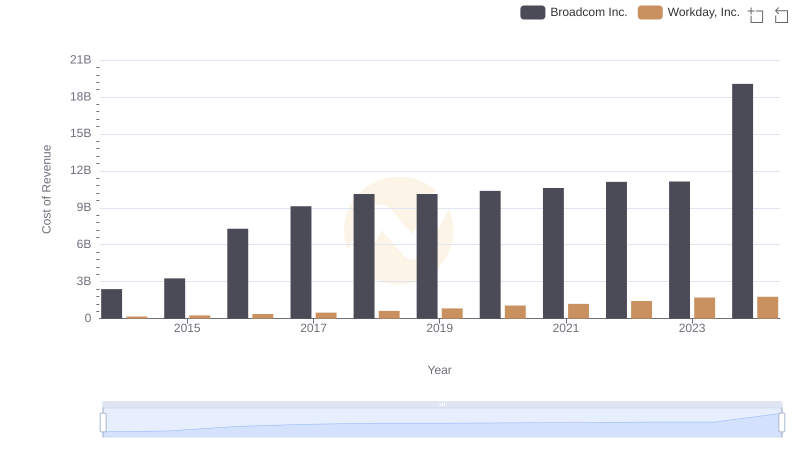
Cost Insights: Breaking Down Broadcom Inc. and Workday, Inc.'s Expenses
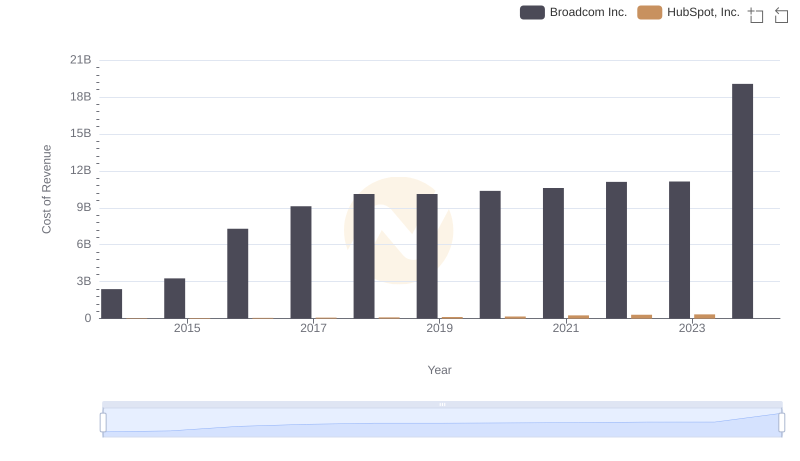
Broadcom Inc. vs HubSpot, Inc.: Efficiency in Cost of Revenue Explored
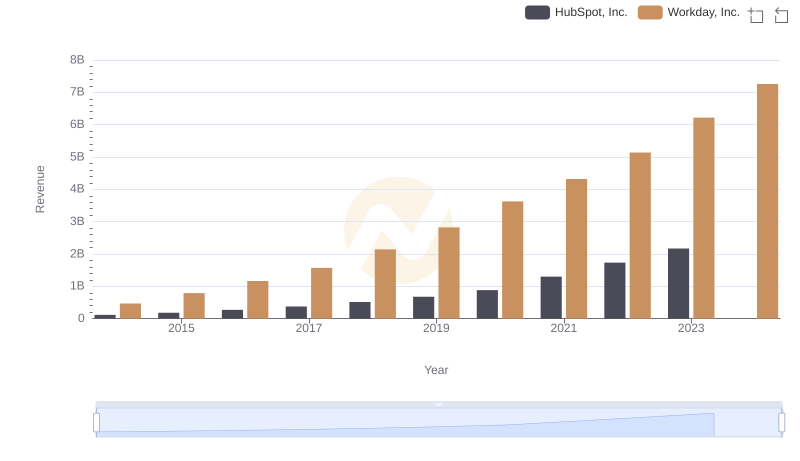
Breaking Down Revenue Trends: Workday, Inc. vs HubSpot, Inc.
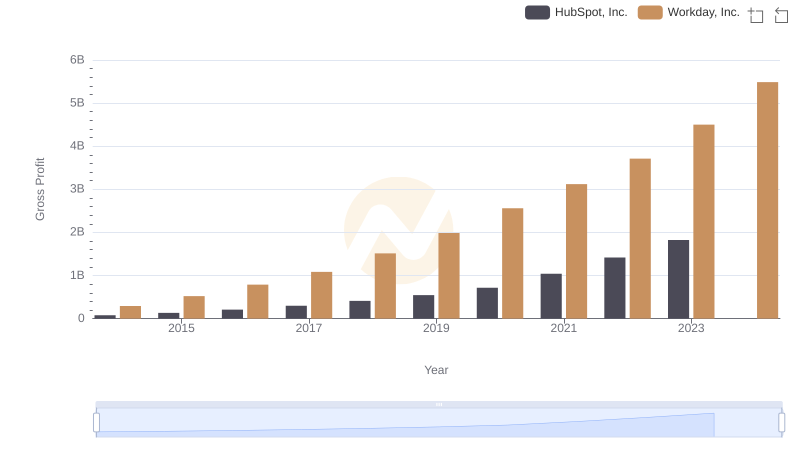
Workday, Inc. and HubSpot, Inc.: A Detailed Gross Profit Analysis
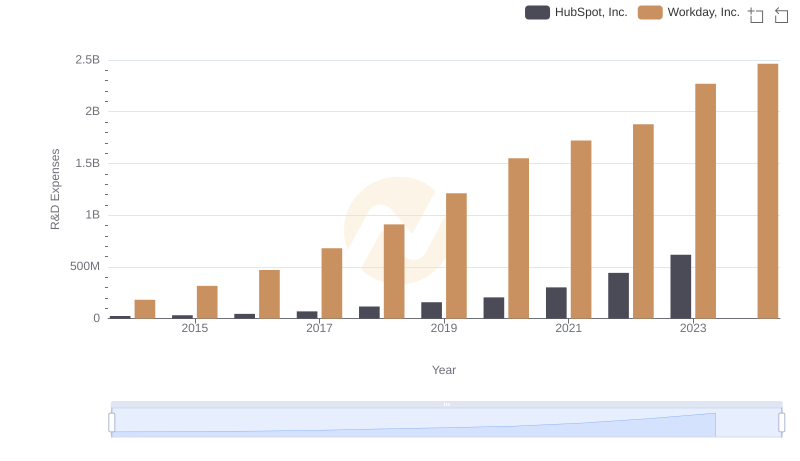
Analyzing R&D Budgets: Workday, Inc. vs HubSpot, Inc.
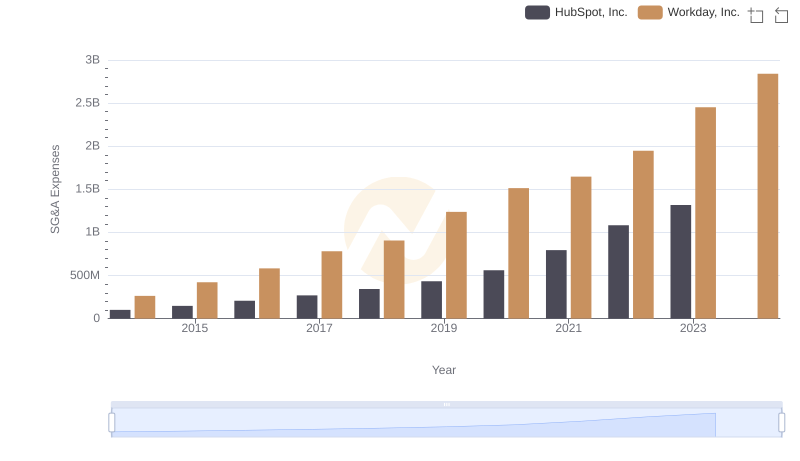
Operational Costs Compared: SG&A Analysis of Workday, Inc. and HubSpot, Inc.