| __timestamp | HubSpot, Inc. | Workday, Inc. |
|---|---|---|
| Wednesday, January 1, 2014 | 101767000 | 263294000 |
| Thursday, January 1, 2015 | 148037000 | 421891000 |
| Friday, January 1, 2016 | 207767000 | 582634000 |
| Sunday, January 1, 2017 | 269646000 | 781996000 |
| Monday, January 1, 2018 | 343278000 | 906276000 |
| Tuesday, January 1, 2019 | 433656000 | 1238682000 |
| Wednesday, January 1, 2020 | 561306000 | 1514272000 |
| Friday, January 1, 2021 | 794630000 | 1647241000 |
| Saturday, January 1, 2022 | 1083789000 | 1947933000 |
| Sunday, January 1, 2023 | 1318209000 | 2452180000 |
| Monday, January 1, 2024 | 1519176000 | 2841000000 |
In pursuit of knowledge
In the ever-evolving landscape of enterprise software, operational efficiency is paramount. Over the past decade, Workday, Inc. and HubSpot, Inc. have demonstrated contrasting trajectories in their Selling, General, and Administrative (SG&A) expenses. From 2014 to 2023, HubSpot's SG&A expenses surged by over 1,200%, reflecting its aggressive growth strategy. Meanwhile, Workday's expenses increased by approximately 830%, showcasing its steady expansion.
Notably, 2024 data for HubSpot is unavailable, suggesting a potential shift or anomaly in reporting. This analysis underscores the dynamic nature of operational strategies in the tech industry.
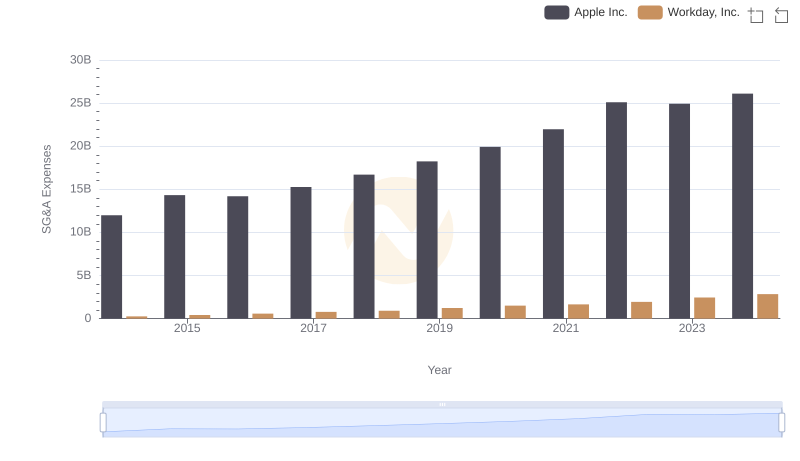
SG&A Efficiency Analysis: Comparing Apple Inc. and Workday, Inc.
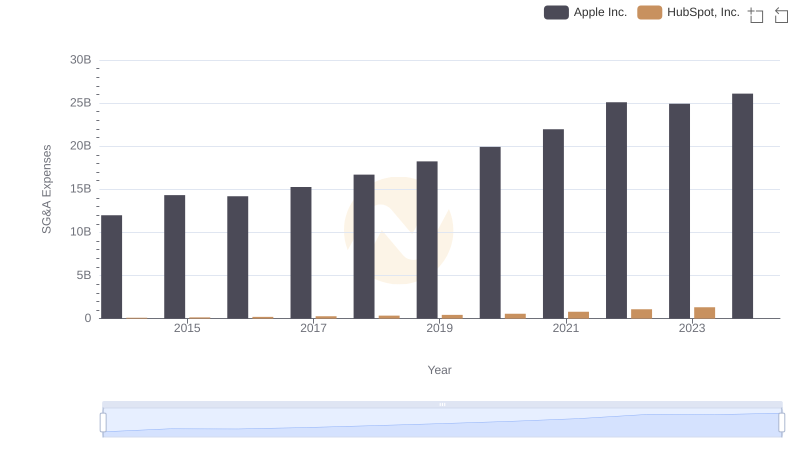
Cost Management Insights: SG&A Expenses for Apple Inc. and HubSpot, Inc.
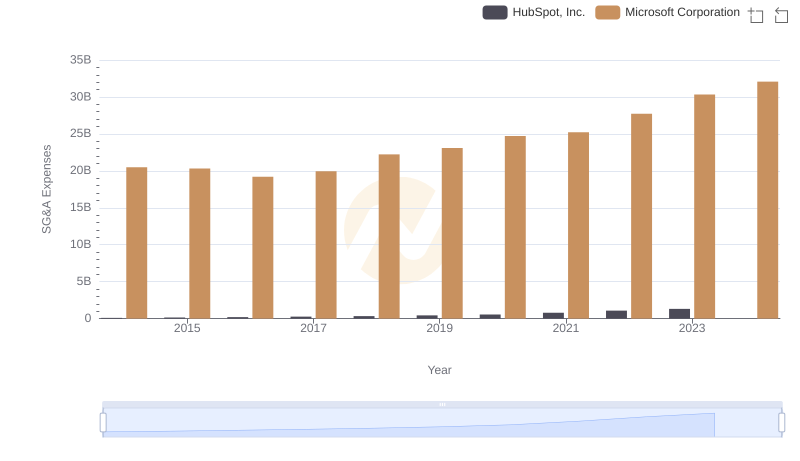
Microsoft Corporation or HubSpot, Inc.: Who Manages SG&A Costs Better?
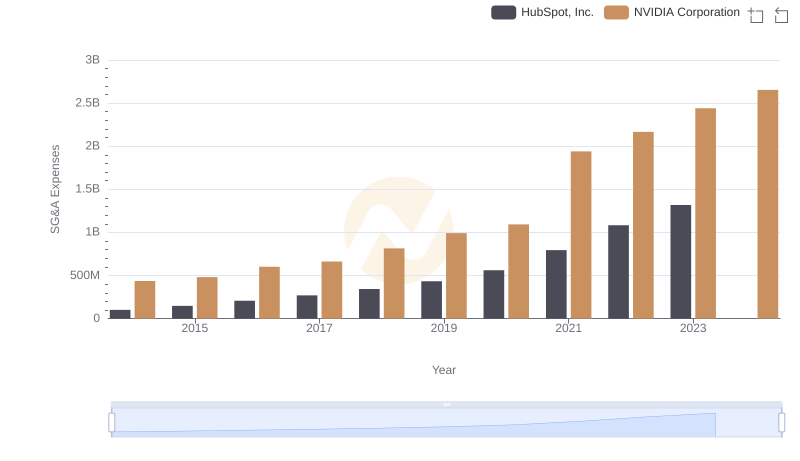
Who Optimizes SG&A Costs Better? NVIDIA Corporation or HubSpot, Inc.
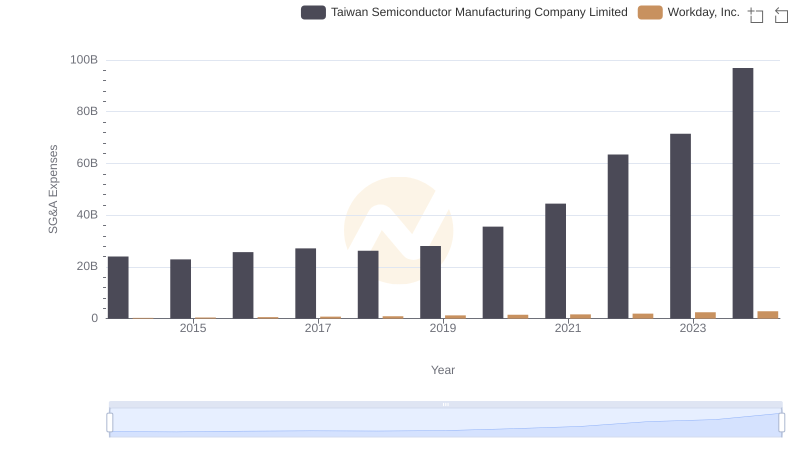
Taiwan Semiconductor Manufacturing Company Limited or Workday, Inc.: Who Manages SG&A Costs Better?
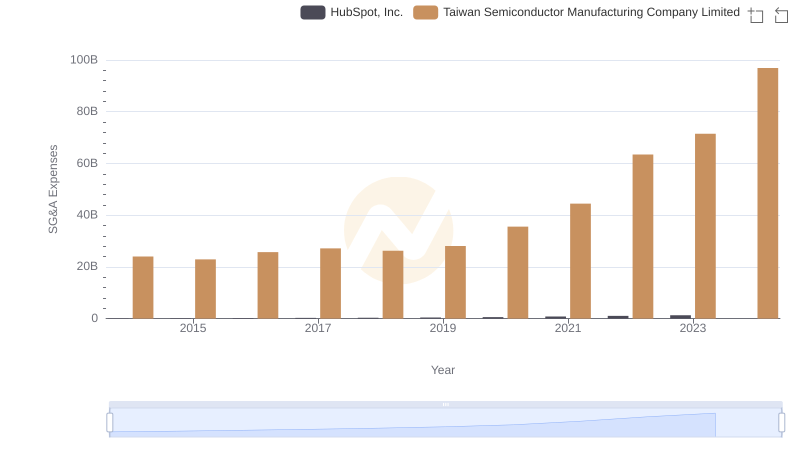
Taiwan Semiconductor Manufacturing Company Limited or HubSpot, Inc.: Who Manages SG&A Costs Better?
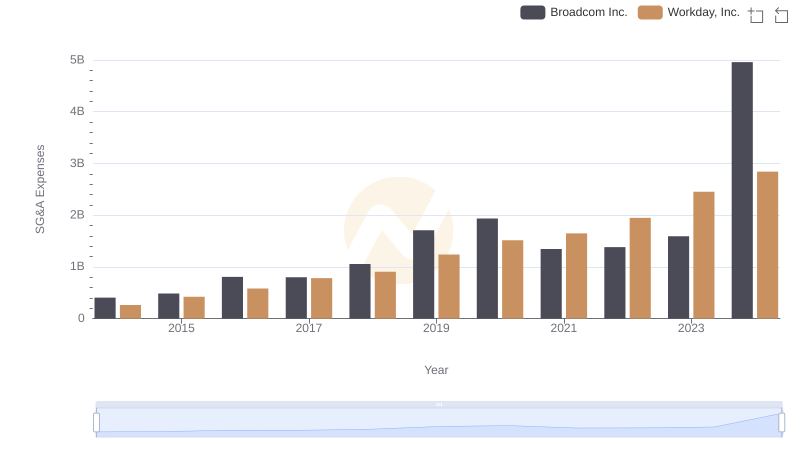
Cost Management Insights: SG&A Expenses for Broadcom Inc. and Workday, Inc.
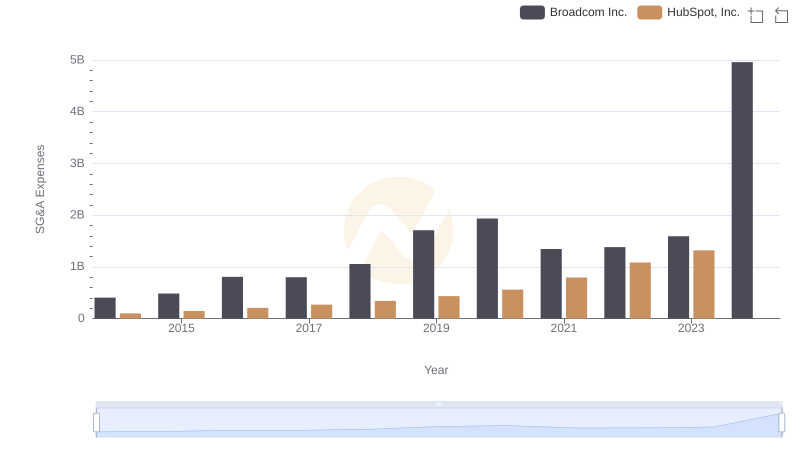
Selling, General, and Administrative Costs: Broadcom Inc. vs HubSpot, Inc.
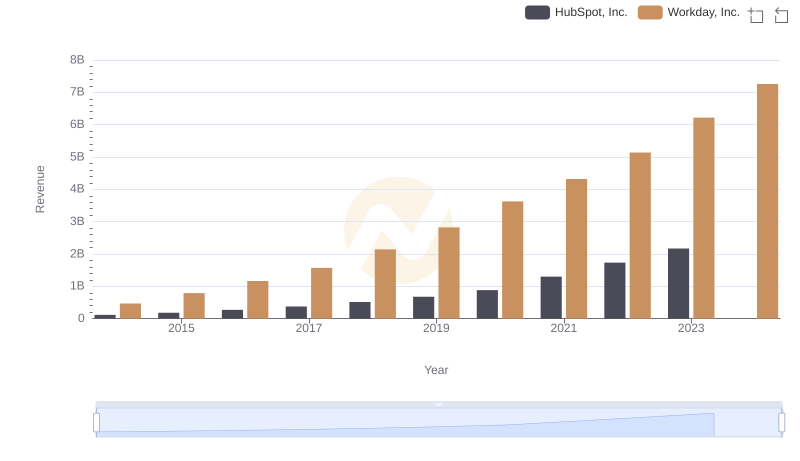
Breaking Down Revenue Trends: Workday, Inc. vs HubSpot, Inc.
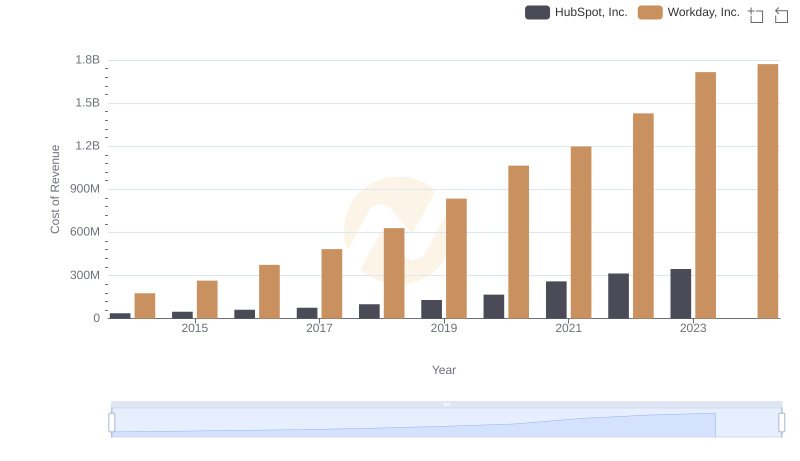
Cost Insights: Breaking Down Workday, Inc. and HubSpot, Inc.'s Expenses
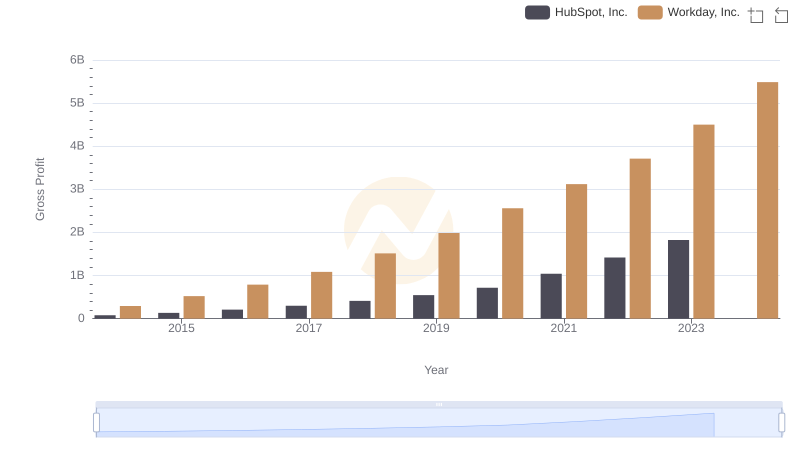
Workday, Inc. and HubSpot, Inc.: A Detailed Gross Profit Analysis
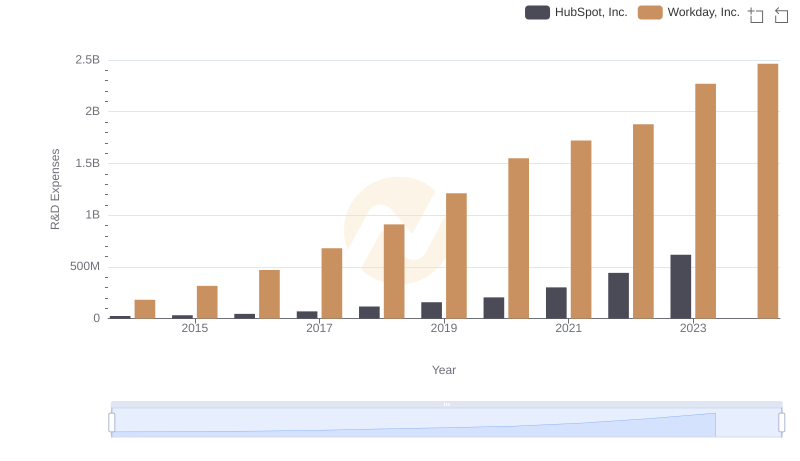
Analyzing R&D Budgets: Workday, Inc. vs HubSpot, Inc.