| __timestamp | Autodesk, Inc. | SS&C Technologies Holdings, Inc. |
|---|---|---|
| Wednesday, January 1, 2014 | 2273900000 | 767861000 |
| Thursday, January 1, 2015 | 2512200000 | 1000285000 |
| Friday, January 1, 2016 | 2504100000 | 1481436000 |
| Sunday, January 1, 2017 | 2031000000 | 1675295000 |
| Monday, January 1, 2018 | 2056600000 | 3421100000 |
| Tuesday, January 1, 2019 | 2569800000 | 4632900000 |
| Wednesday, January 1, 2020 | 3274300000 | 4667900000 |
| Friday, January 1, 2021 | 3790400000 | 5051000000 |
| Saturday, January 1, 2022 | 4386400000 | 5283000000 |
| Sunday, January 1, 2023 | 5005000000 | 5502800000 |
| Monday, January 1, 2024 | 5440000000 | 5882000000 |
Cracking the code
In the dynamic world of technology, revenue growth is a key indicator of success. From 2014 to 2023, Autodesk, Inc. and SS&C Technologies Holdings, Inc. have been neck and neck in their revenue generation. Autodesk started with a revenue of approximately $2.3 billion in 2014, while SS&C Technologies was at a modest $768 million. Fast forward to 2023, Autodesk's revenue surged by over 120% to reach $5 billion, whereas SS&C Technologies saw an impressive growth of over 600%, reaching $5.5 billion.
Despite Autodesk's consistent growth, SS&C Technologies outpaced it in recent years, particularly from 2018 onwards, where it consistently generated more revenue. The data for 2024 is incomplete, but the trend suggests a continued rivalry. This financial duel highlights the competitive nature of the tech industry, where innovation and strategic acquisitions can significantly impact revenue trajectories.
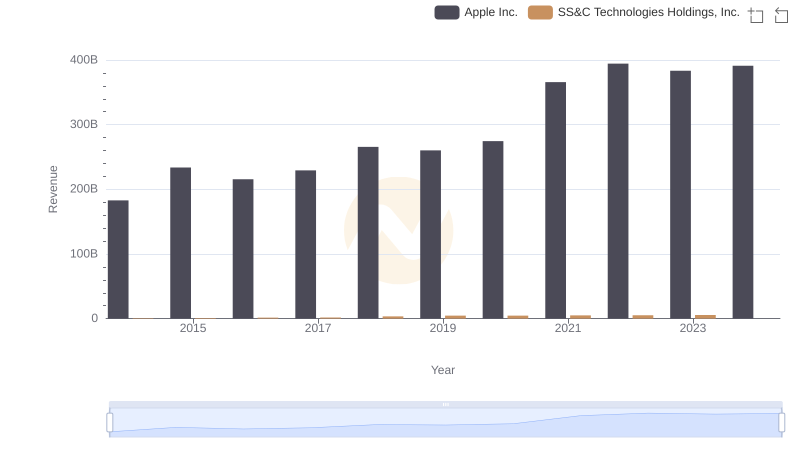
Apple Inc. and SS&C Technologies Holdings, Inc.: A Comprehensive Revenue Analysis
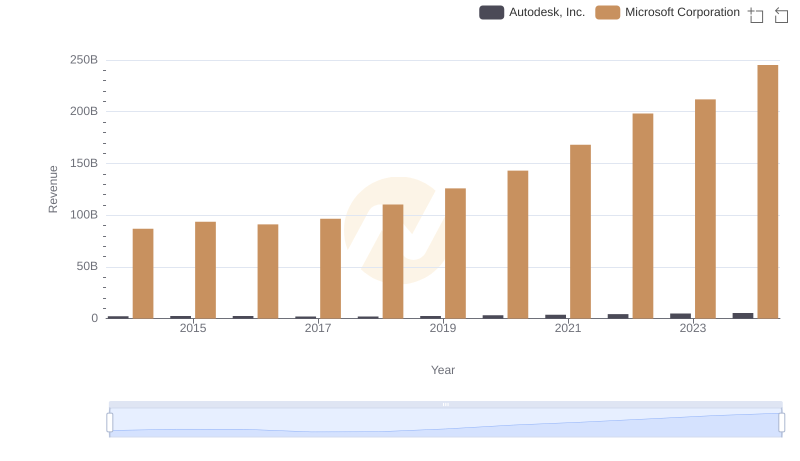
Revenue Showdown: Microsoft Corporation vs Autodesk, Inc.
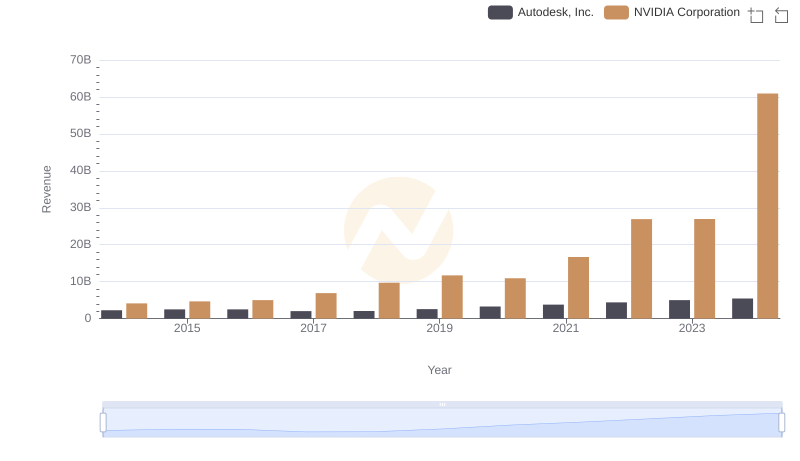
Comparing Revenue Performance: NVIDIA Corporation or Autodesk, Inc.?
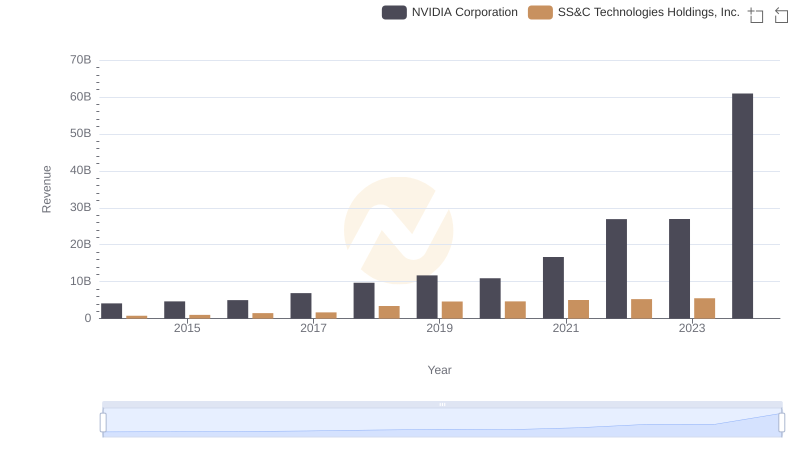
NVIDIA Corporation or SS&C Technologies Holdings, Inc.: Who Leads in Yearly Revenue?
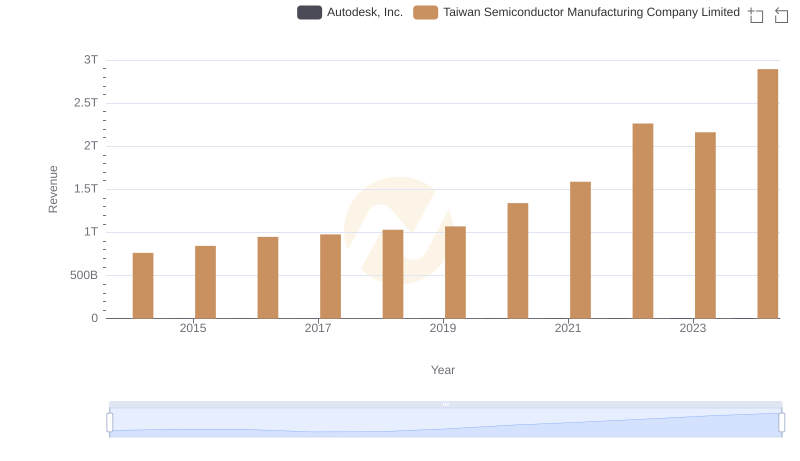
Taiwan Semiconductor Manufacturing Company Limited and Autodesk, Inc.: A Comprehensive Revenue Analysis
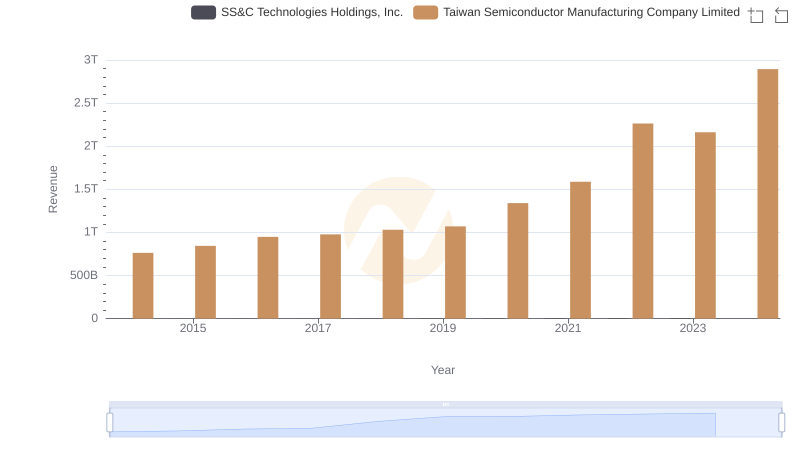
Taiwan Semiconductor Manufacturing Company Limited and SS&C Technologies Holdings, Inc.: A Comprehensive Revenue Analysis
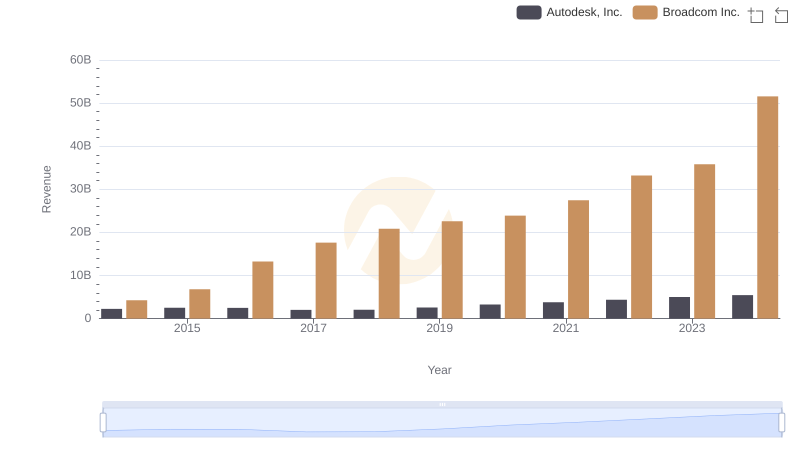
Comparing Revenue Performance: Broadcom Inc. or Autodesk, Inc.?
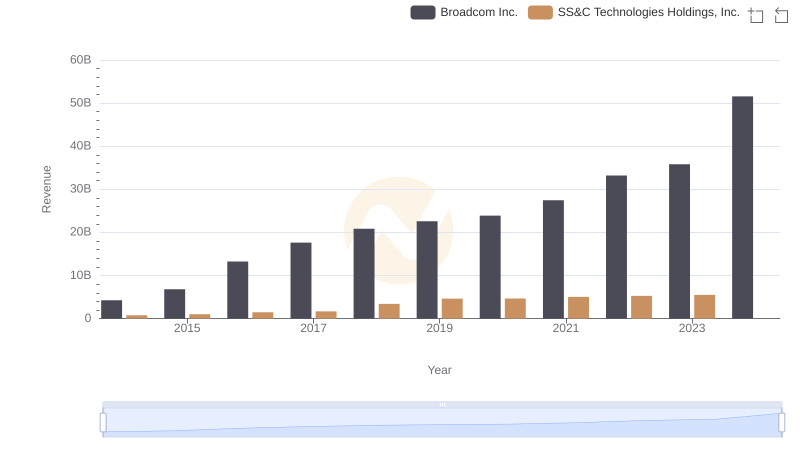
Revenue Showdown: Broadcom Inc. vs SS&C Technologies Holdings, Inc.
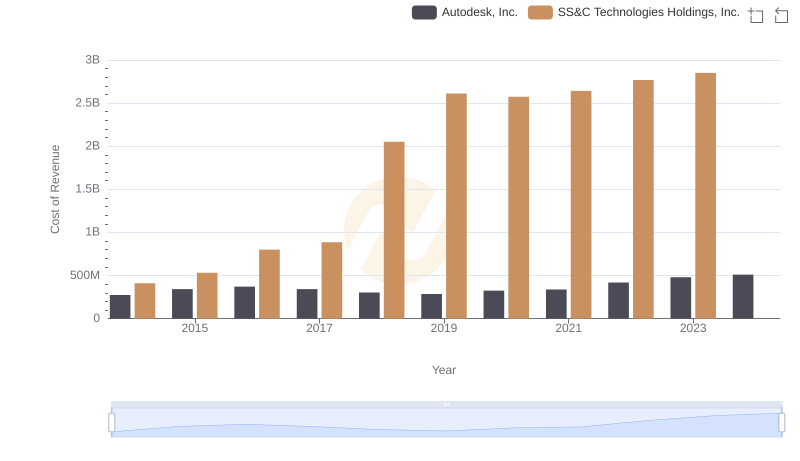
Cost of Revenue: Key Insights for Autodesk, Inc. and SS&C Technologies Holdings, Inc.
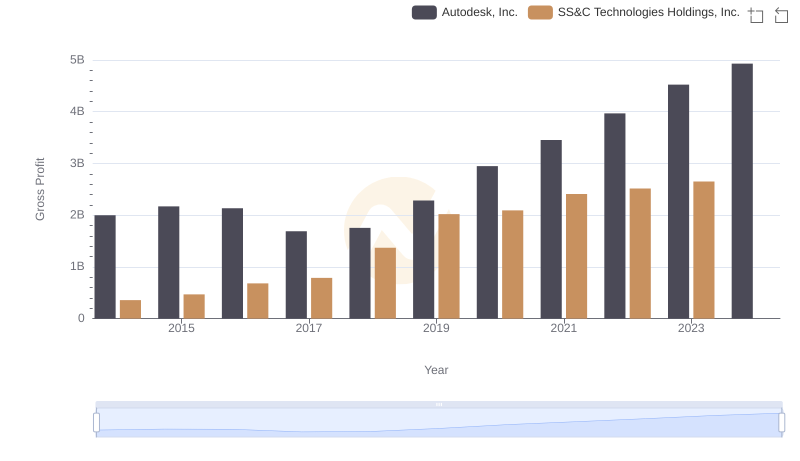
Gross Profit Analysis: Comparing Autodesk, Inc. and SS&C Technologies Holdings, Inc.
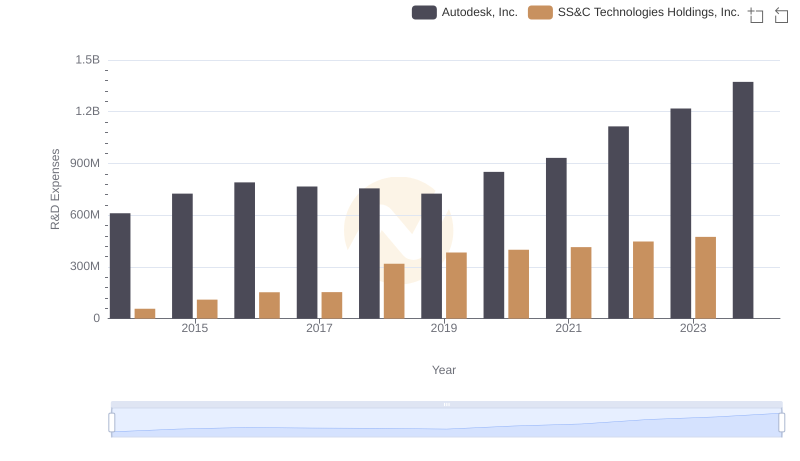
R&D Spending Showdown: Autodesk, Inc. vs SS&C Technologies Holdings, Inc.
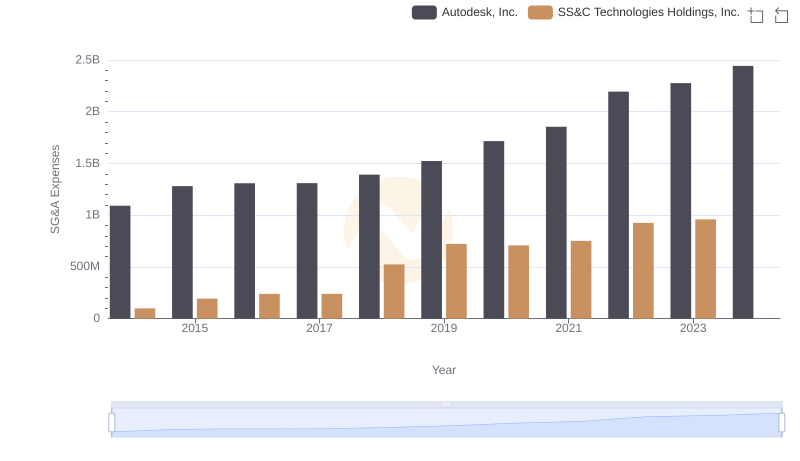
Breaking Down SG&A Expenses: Autodesk, Inc. vs SS&C Technologies Holdings, Inc.