| __timestamp | Autodesk, Inc. | SS&C Technologies Holdings, Inc. |
|---|---|---|
| Wednesday, January 1, 2014 | 1090900000 | 99471000 |
| Thursday, January 1, 2015 | 1281300000 | 192782000 |
| Friday, January 1, 2016 | 1308900000 | 239563000 |
| Sunday, January 1, 2017 | 1310300000 | 238623000 |
| Monday, January 1, 2018 | 1392500000 | 524900000 |
| Tuesday, January 1, 2019 | 1524000000 | 723100000 |
| Wednesday, January 1, 2020 | 1715900000 | 708600000 |
| Friday, January 1, 2021 | 1854200000 | 752100000 |
| Saturday, January 1, 2022 | 2194800000 | 925100000 |
| Sunday, January 1, 2023 | 2277000000 | 959700000 |
| Monday, January 1, 2024 | 2443000000 | 1002400000 |
Data in motion
In the ever-evolving landscape of technology companies, understanding financial health is crucial. This analysis delves into the Selling, General, and Administrative (SG&A) expenses of two industry giants: Autodesk, Inc. and SS&C Technologies Holdings, Inc., from 2014 to 2023.
Autodesk has shown a consistent upward trend in SG&A expenses, starting at approximately $1.1 billion in 2014 and reaching around $2.3 billion by 2023. This represents a growth of over 100% in a decade, reflecting its expanding operations and market reach.
In contrast, SS&C Technologies began with a modest $99 million in 2014, climbing to nearly $960 million by 2023. This tenfold increase highlights its aggressive growth strategy and market penetration.
While Autodesk's expenses are higher, SS&C's rapid growth rate is noteworthy. However, data for 2024 is incomplete, leaving room for speculation on future trends.
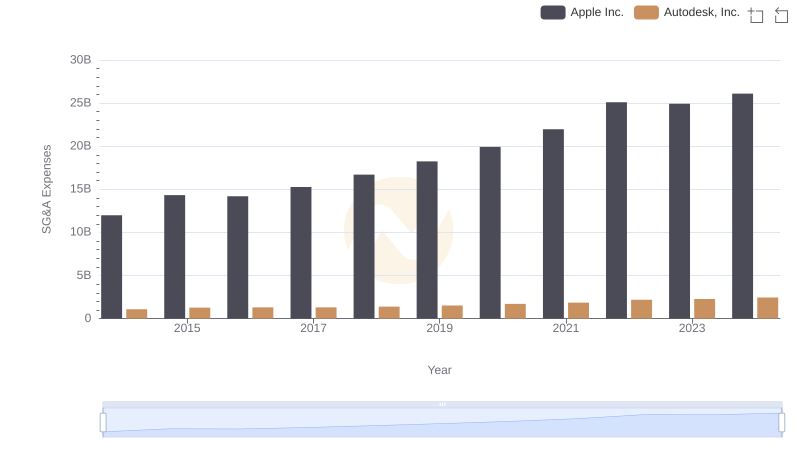
Cost Management Insights: SG&A Expenses for Apple Inc. and Autodesk, Inc.
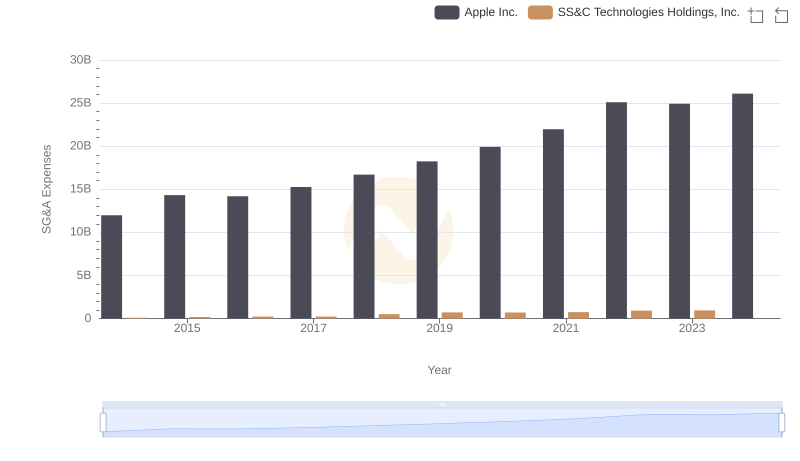
SG&A Efficiency Analysis: Comparing Apple Inc. and SS&C Technologies Holdings, Inc.
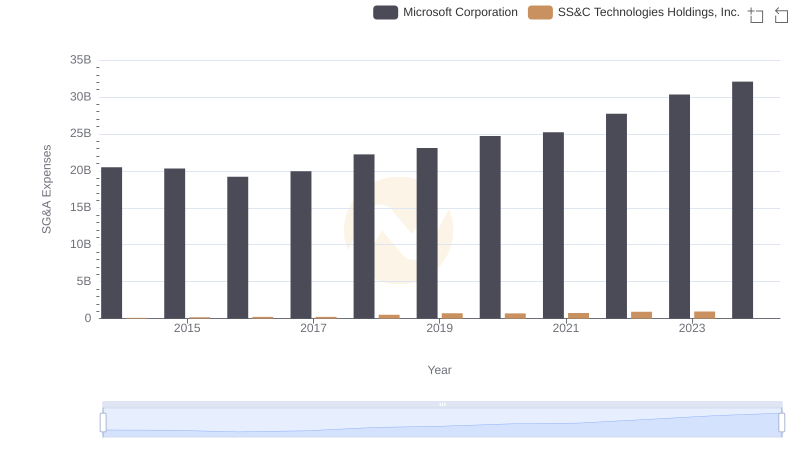
Microsoft Corporation and SS&C Technologies Holdings, Inc.: SG&A Spending Patterns Compared
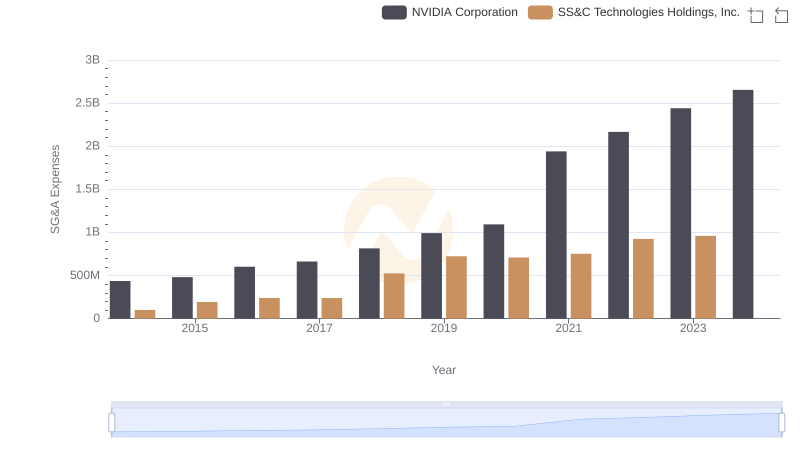
NVIDIA Corporation vs SS&C Technologies Holdings, Inc.: SG&A Expense Trends
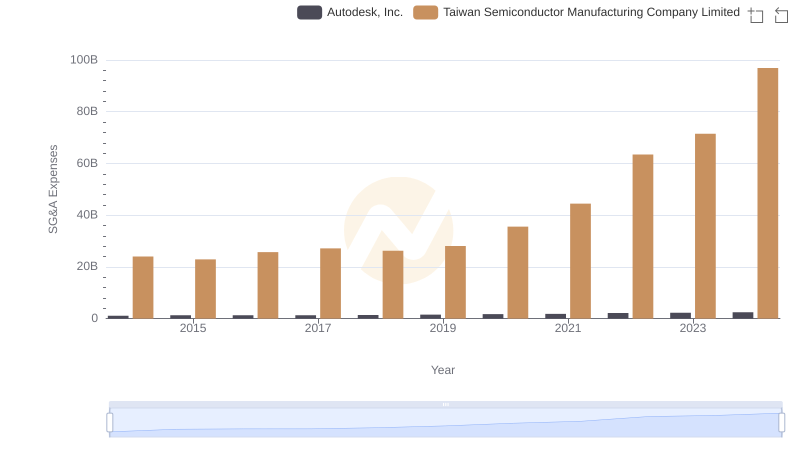
Operational Costs Compared: SG&A Analysis of Taiwan Semiconductor Manufacturing Company Limited and Autodesk, Inc.
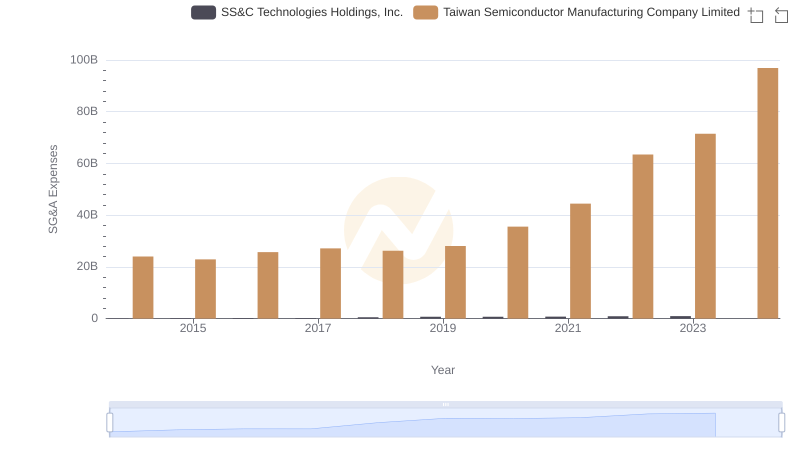
Who Optimizes SG&A Costs Better? Taiwan Semiconductor Manufacturing Company Limited or SS&C Technologies Holdings, Inc.
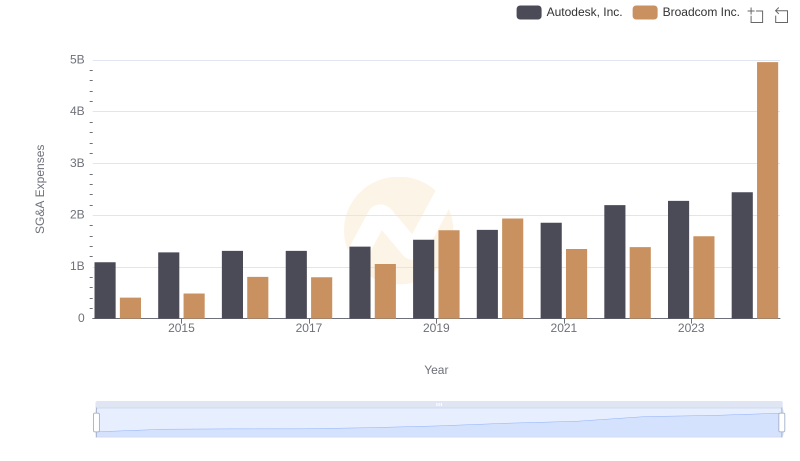
Who Optimizes SG&A Costs Better? Broadcom Inc. or Autodesk, Inc.
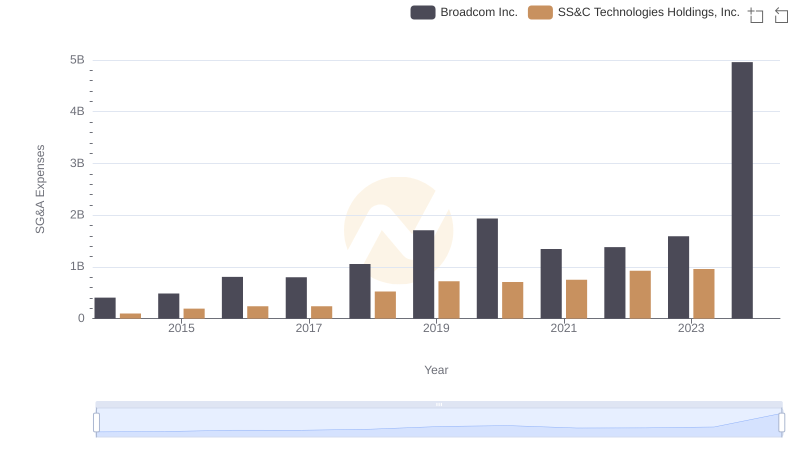
Selling, General, and Administrative Costs: Broadcom Inc. vs SS&C Technologies Holdings, Inc.
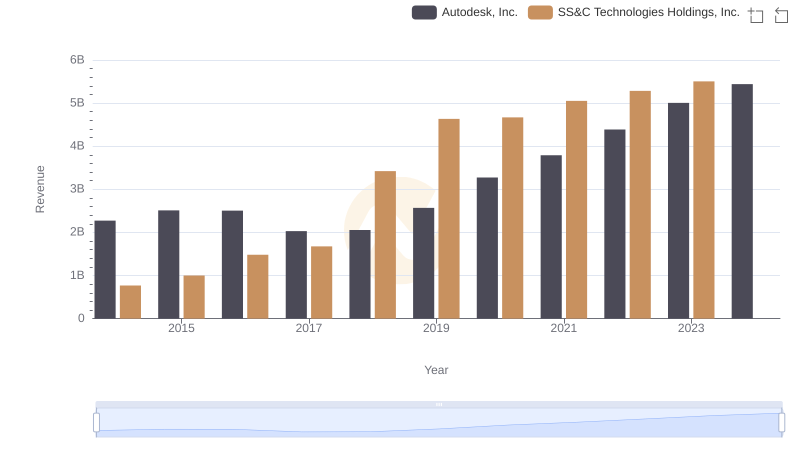
Who Generates More Revenue? Autodesk, Inc. or SS&C Technologies Holdings, Inc.
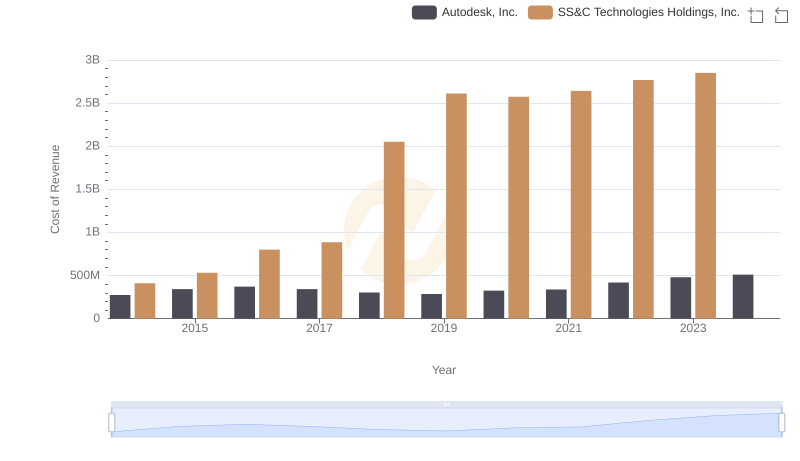
Cost of Revenue: Key Insights for Autodesk, Inc. and SS&C Technologies Holdings, Inc.
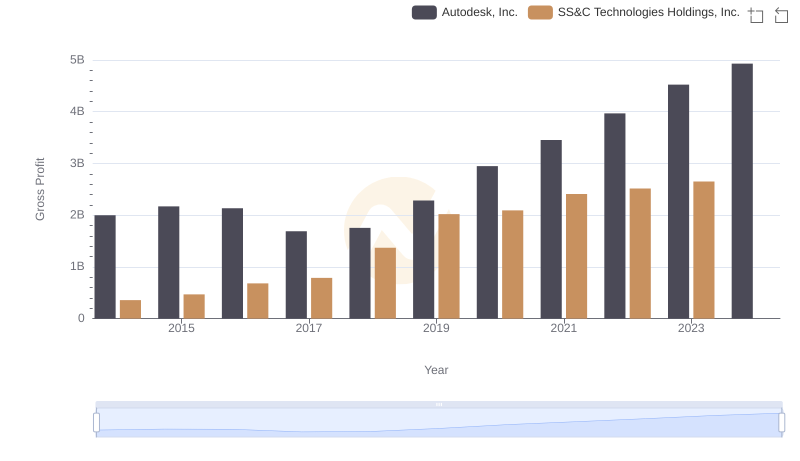
Gross Profit Analysis: Comparing Autodesk, Inc. and SS&C Technologies Holdings, Inc.
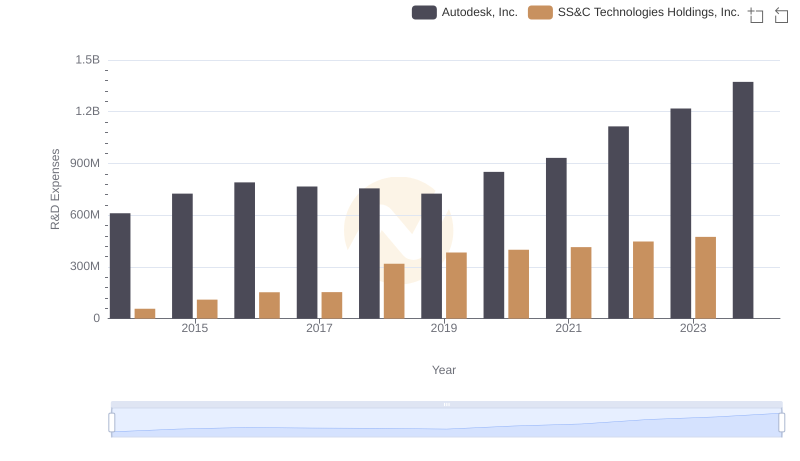
R&D Spending Showdown: Autodesk, Inc. vs SS&C Technologies Holdings, Inc.