| __timestamp | Autodesk, Inc. | SS&C Technologies Holdings, Inc. |
|---|---|---|
| Wednesday, January 1, 2014 | 274300000 | 410731000 |
| Thursday, January 1, 2015 | 342100000 | 532350000 |
| Friday, January 1, 2016 | 370700000 | 800489000 |
| Sunday, January 1, 2017 | 341900000 | 886425000 |
| Monday, January 1, 2018 | 303400000 | 2051100000 |
| Tuesday, January 1, 2019 | 285900000 | 2611700000 |
| Wednesday, January 1, 2020 | 324900000 | 2574100000 |
| Friday, January 1, 2021 | 337100000 | 2641700000 |
| Saturday, January 1, 2022 | 418500000 | 2767700000 |
| Sunday, January 1, 2023 | 480000000 | 2851000000 |
| Monday, January 1, 2024 | 463000000 | 3018400000 |
Unveiling the hidden dimensions of data
In the ever-evolving landscape of technology and software, understanding the cost of revenue is crucial for investors and stakeholders. Over the past decade, Autodesk, Inc. and SS&C Technologies Holdings, Inc. have shown distinct trajectories in their cost of revenue, reflecting their strategic priorities and market dynamics.
From 2014 to 2023, Autodesk's cost of revenue increased by approximately 86%, highlighting its expanding operations and investment in product development. In contrast, SS&C Technologies experienced a staggering 594% rise in the same period, underscoring its aggressive growth strategy and acquisitions.
Interestingly, while Autodesk's cost of revenue showed a steady upward trend, SS&C Technologies' figures were more volatile, peaking in 2023. This divergence suggests differing business models and market responses, offering valuable insights for potential investors.
As we look to the future, the absence of data for SS&C Technologies in 2024 leaves room for speculation on its strategic direction.
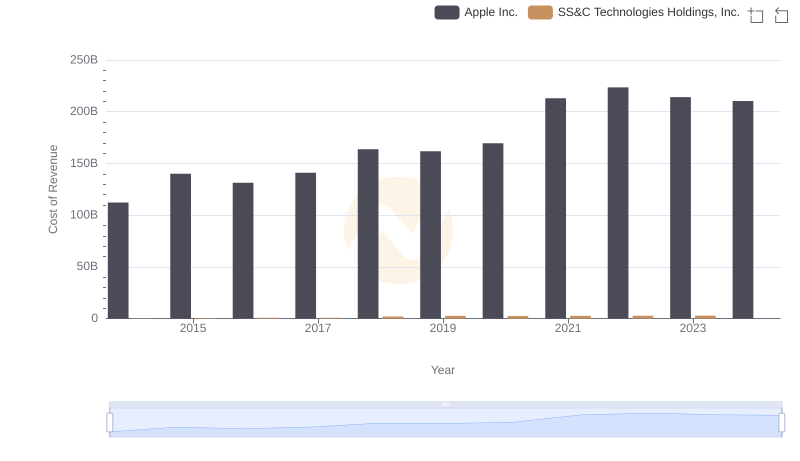
Cost of Revenue Comparison: Apple Inc. vs SS&C Technologies Holdings, Inc.
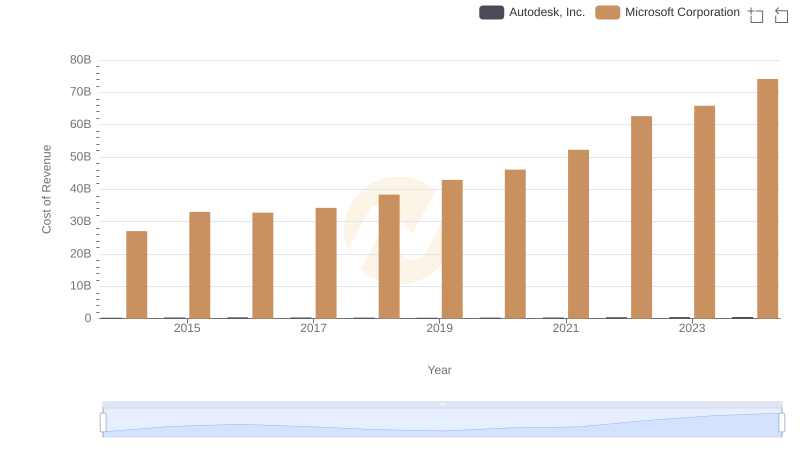
Cost Insights: Breaking Down Microsoft Corporation and Autodesk, Inc.'s Expenses
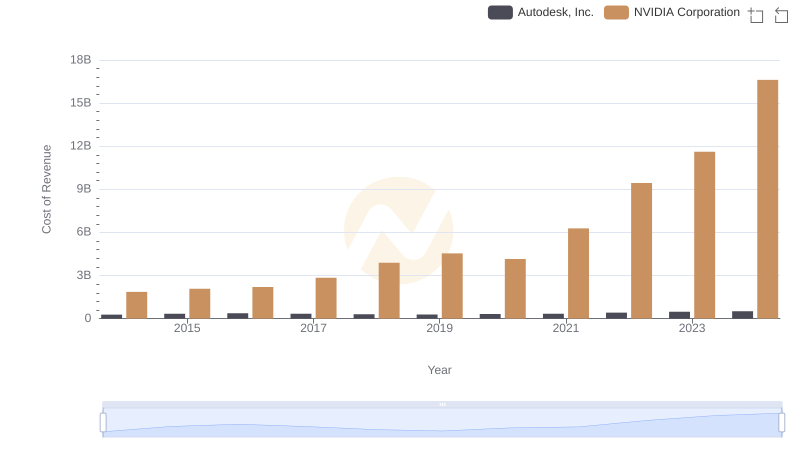
Cost of Revenue Comparison: NVIDIA Corporation vs Autodesk, Inc.
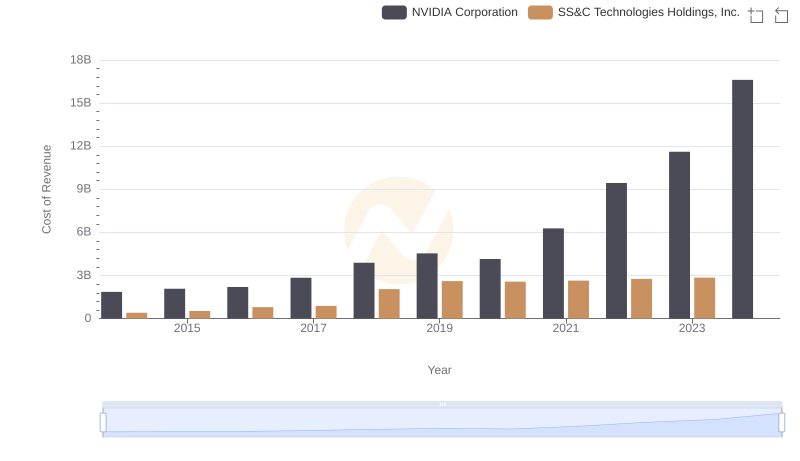
Analyzing Cost of Revenue: NVIDIA Corporation and SS&C Technologies Holdings, Inc.
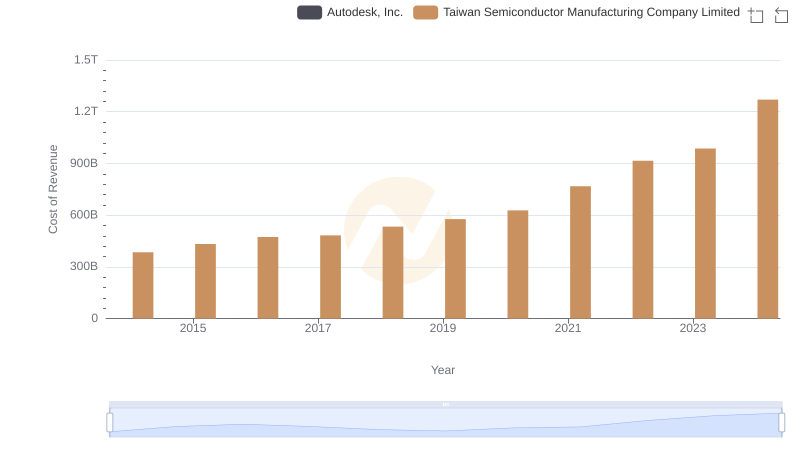
Cost of Revenue: Key Insights for Taiwan Semiconductor Manufacturing Company Limited and Autodesk, Inc.
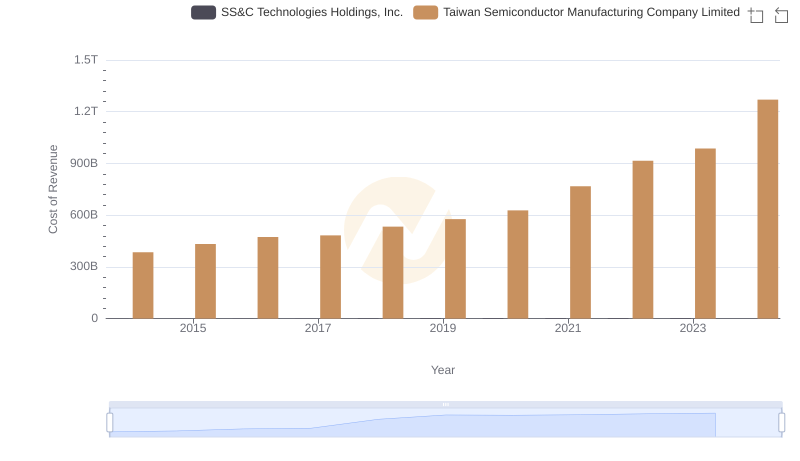
Cost of Revenue Comparison: Taiwan Semiconductor Manufacturing Company Limited vs SS&C Technologies Holdings, Inc.
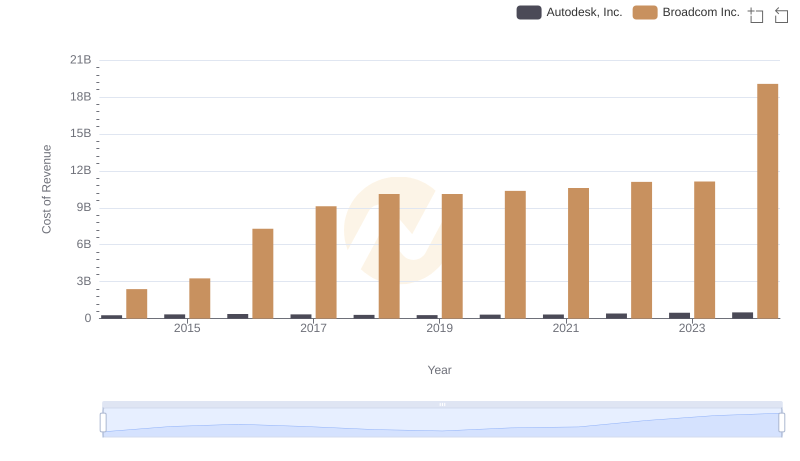
Cost of Revenue: Key Insights for Broadcom Inc. and Autodesk, Inc.
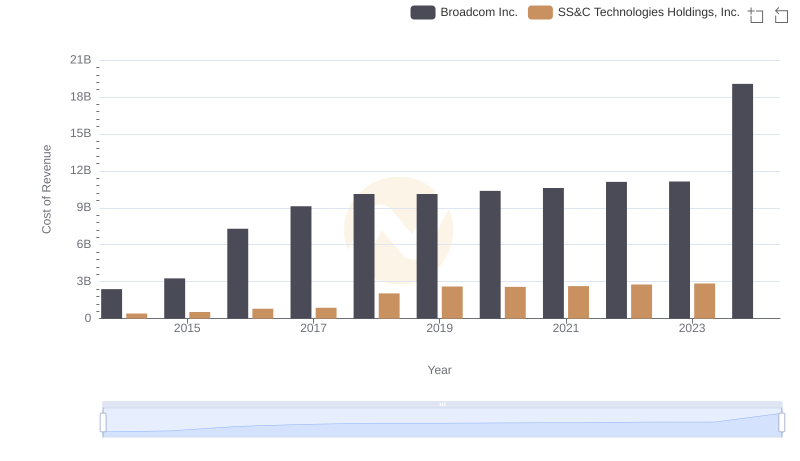
Comparing Cost of Revenue Efficiency: Broadcom Inc. vs SS&C Technologies Holdings, Inc.
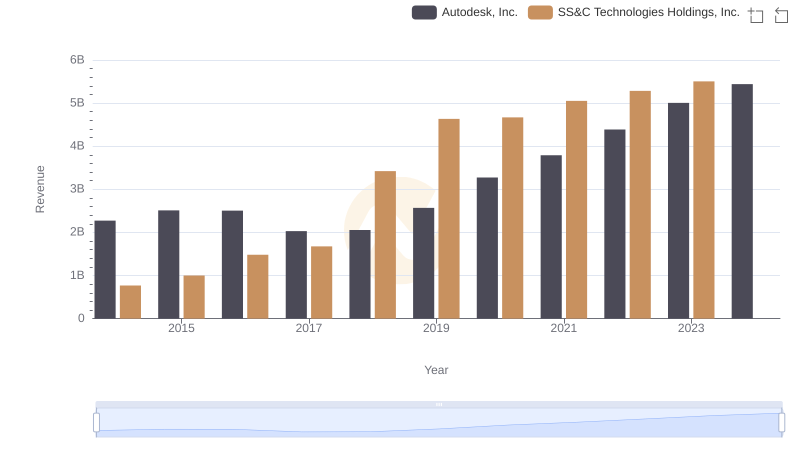
Who Generates More Revenue? Autodesk, Inc. or SS&C Technologies Holdings, Inc.
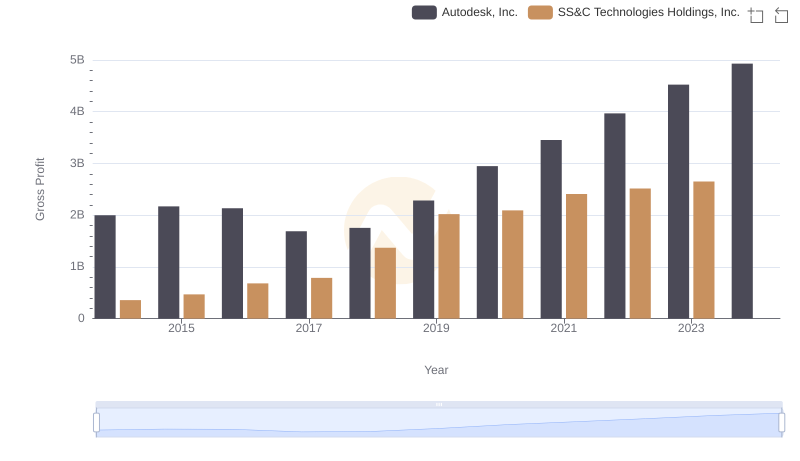
Gross Profit Analysis: Comparing Autodesk, Inc. and SS&C Technologies Holdings, Inc.
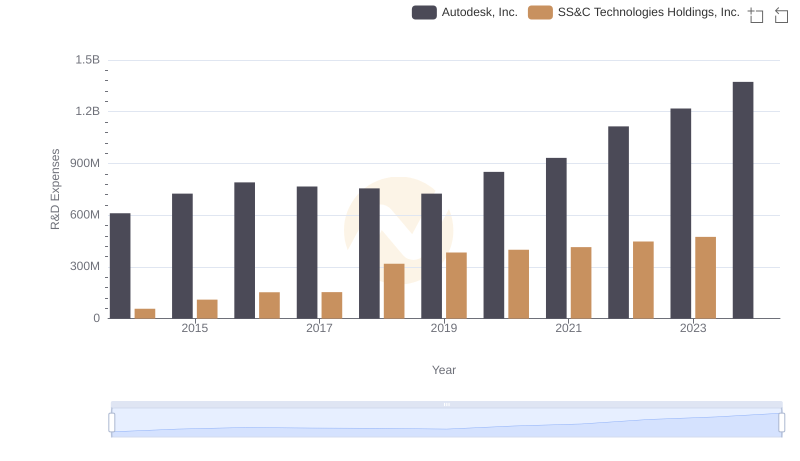
R&D Spending Showdown: Autodesk, Inc. vs SS&C Technologies Holdings, Inc.
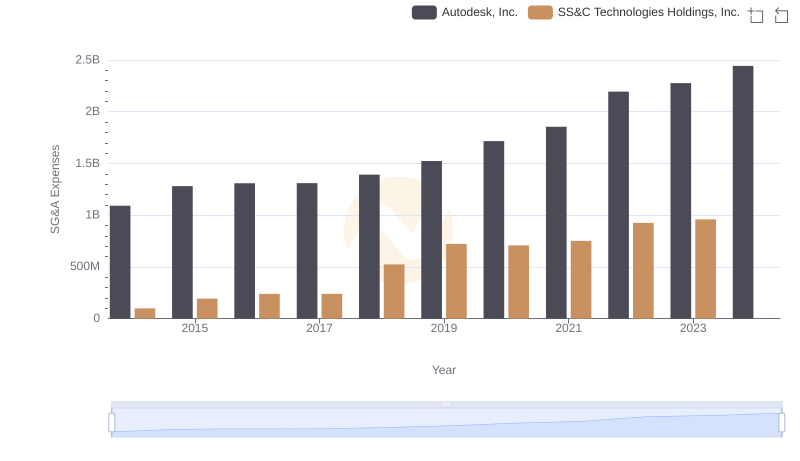
Breaking Down SG&A Expenses: Autodesk, Inc. vs SS&C Technologies Holdings, Inc.