| __timestamp | Waste Management, Inc. | ZTO Express (Cayman) Inc. |
|---|---|---|
| Wednesday, January 1, 2014 | 1481000000 | 534537000 |
| Thursday, January 1, 2015 | 1343000000 | 591738000 |
| Friday, January 1, 2016 | 1410000000 | 705995000 |
| Sunday, January 1, 2017 | 1468000000 | 780517000 |
| Monday, January 1, 2018 | 1453000000 | 1210717000 |
| Tuesday, January 1, 2019 | 1631000000 | 1546227000 |
| Wednesday, January 1, 2020 | 1728000000 | 1663712000 |
| Friday, January 1, 2021 | 1864000000 | 1875869000 |
| Saturday, January 1, 2022 | 1938000000 | 2077372000 |
| Sunday, January 1, 2023 | 1926000000 | 2425253000 |
| Monday, January 1, 2024 | 2264000000 |
Cracking the code
In the ever-evolving landscape of corporate finance, understanding the nuances of Selling, General, and Administrative (SG&A) expenses is crucial. Waste Management, Inc., a leader in waste services, and ZTO Express (Cayman) Inc., a prominent player in express delivery, offer a fascinating comparison. Over the past decade, Waste Management's SG&A expenses have grown steadily, peaking at approximately $1.93 billion in 2022, a 31% increase from 2014. Meanwhile, ZTO Express has seen a more dramatic rise, with expenses surging by over 350% from 2014 to 2023, reaching $2.43 billion. This stark contrast highlights ZTO's aggressive expansion strategy in the competitive logistics sector. As we delve into these financial patterns, it becomes evident that strategic spending is pivotal in shaping a company's market position and growth trajectory.
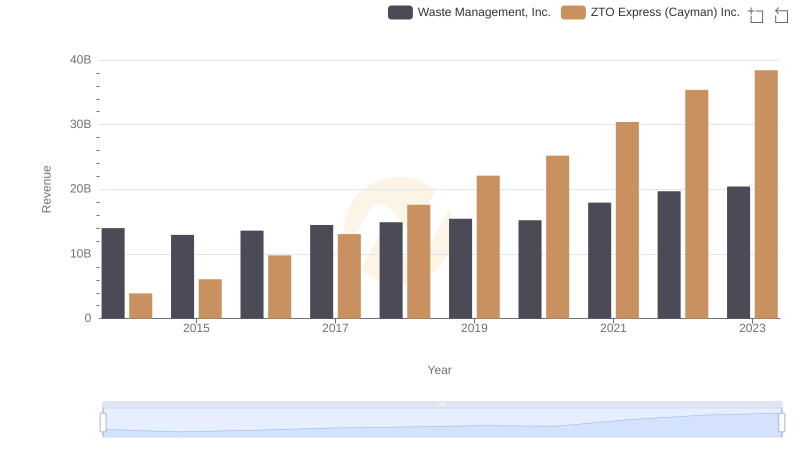
Revenue Insights: Waste Management, Inc. and ZTO Express (Cayman) Inc. Performance Compared
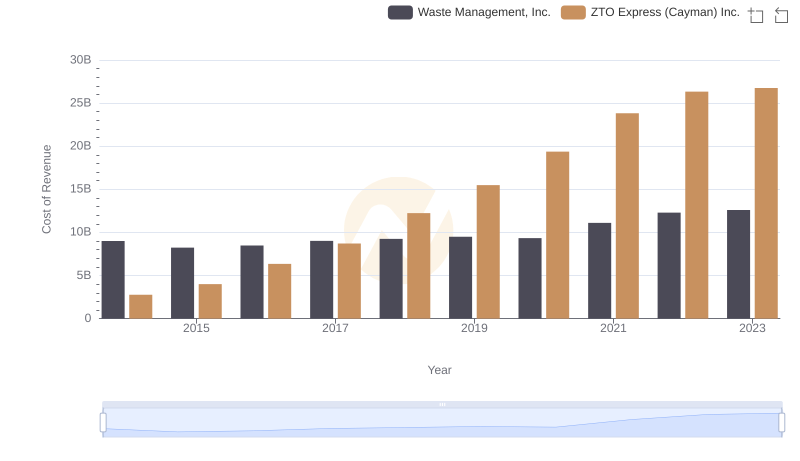
Analyzing Cost of Revenue: Waste Management, Inc. and ZTO Express (Cayman) Inc.
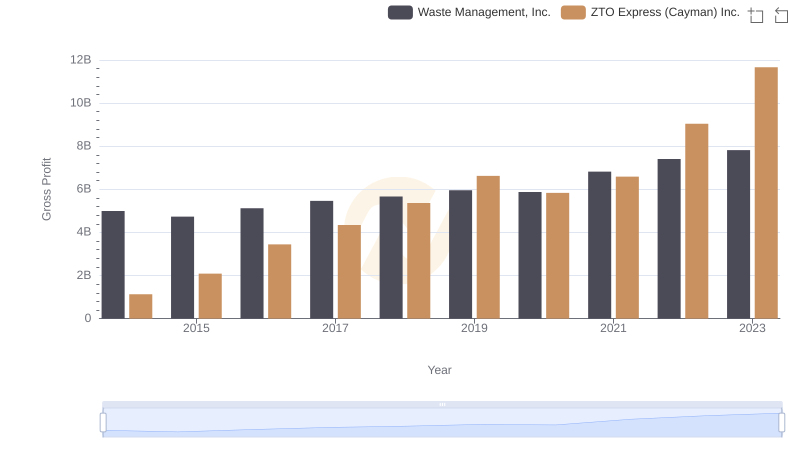
Key Insights on Gross Profit: Waste Management, Inc. vs ZTO Express (Cayman) Inc.
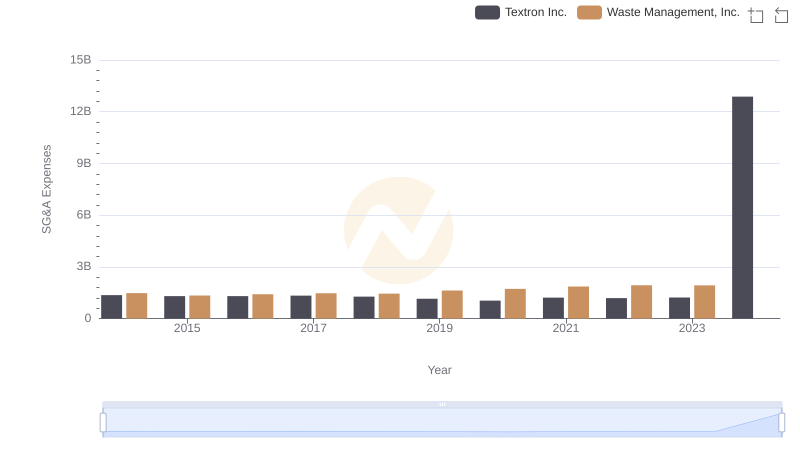
Waste Management, Inc. vs Textron Inc.: SG&A Expense Trends
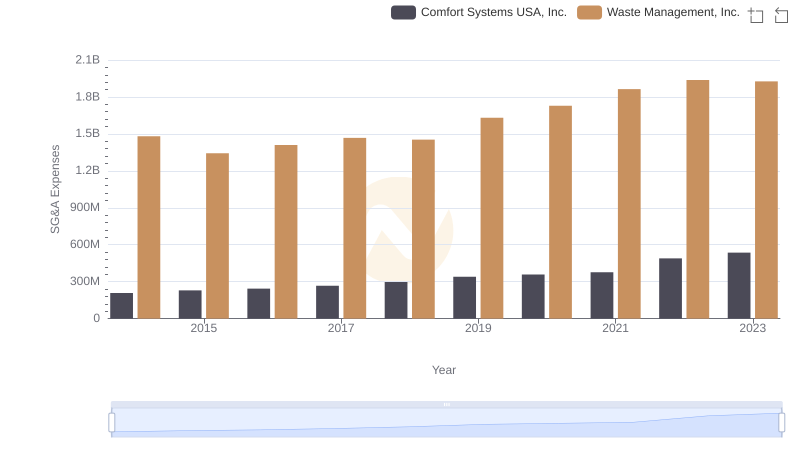
Waste Management, Inc. vs Comfort Systems USA, Inc.: SG&A Expense Trends
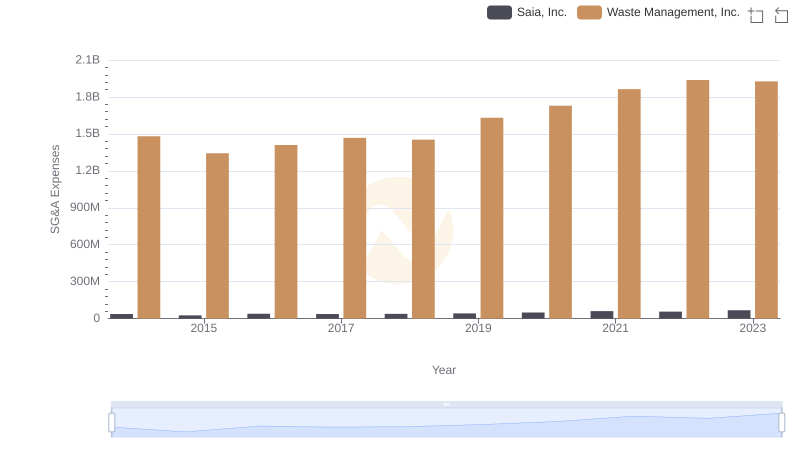
Comparing SG&A Expenses: Waste Management, Inc. vs Saia, Inc. Trends and Insights
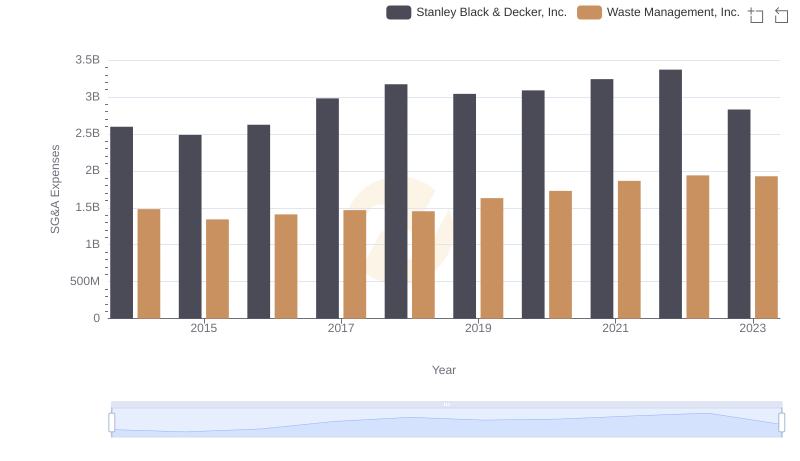
Comparing SG&A Expenses: Waste Management, Inc. vs Stanley Black & Decker, Inc. Trends and Insights
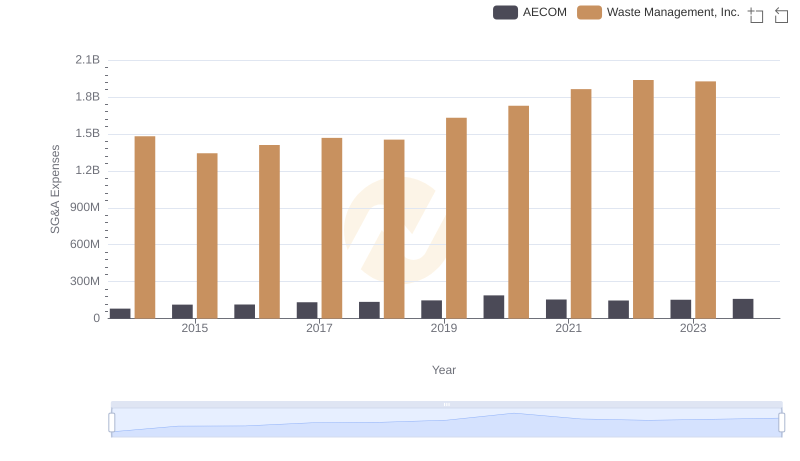
Comparing SG&A Expenses: Waste Management, Inc. vs AECOM Trends and Insights