| Biospecimen Retention Type | Number of Trials |
|---|---|
| 455288 | |
| Samples With DNA | 13960 |
| Samples Without DNA | 8073 |
| None Retained | 665 |
Unlocking the unknown
Exploring the Most Common Biospecimen Retention Types in Clinical Trials
Clinical trials have long been at the forefront of medical research, providing valuable insights into the effectiveness and safety of new treatments. One crucial aspect of these trials is the retention of biospecimens, which play a vital role in understanding the underlying mechanisms of diseases and evaluating the impact of interventions.
Our analysis of a comprehensive dataset reveals the top 5 most common biospecimen retention types in clinical trials. Topping the list is the category 'None Retained', accounting for 445,458 trials. This finding raises intriguing questions about the reasons behind the absence of biospecimen retention in such a large number of trials. Is it due to logistical challenges, ethical considerations, or other factors?
Following closely behind is the category 'Samples With DNA', with 13,671 trials. DNA samples are invaluable for genetic research, enabling scientists to unravel the complex genetic basis of diseases and develop personalized treatments. In third place, we have 'Samples Without DNA', encompassing 7,922 trials. While these samples may lack genetic material, they still hold immense potential for studying other aspects of diseases, such as protein markers or cellular structures.
It is worth noting that our dataset contains some missing values, indicated by the blank entry in the table. These missing values highlight the need for standardized reporting and data collection in clinical trials, ensuring that no valuable information is overlooked.
As we delve deeper into the world of clinical trials, this analysis sheds light on the diverse approaches to biospecimen retention. By understanding the prevalence of different retention types, researchers can make informed decisions about the design and implementation of future trials, ultimately advancing medical knowledge and improving patient outcomes.
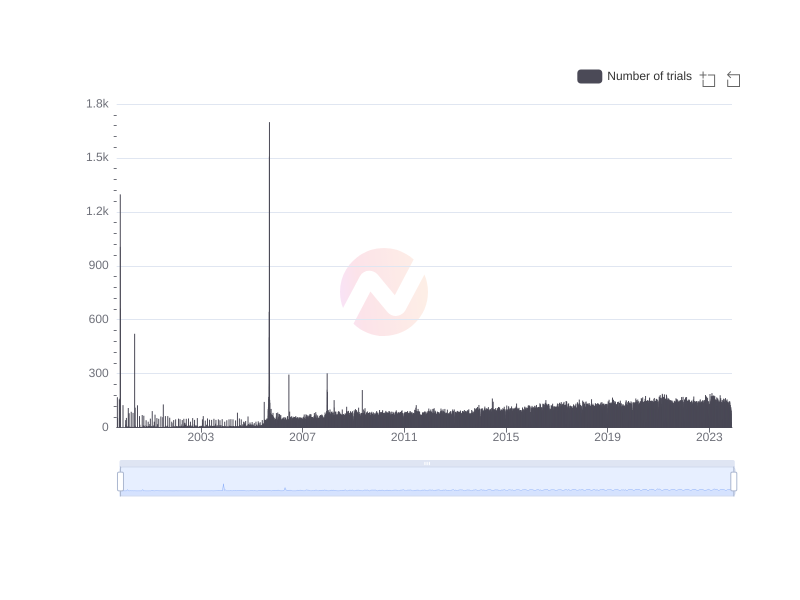
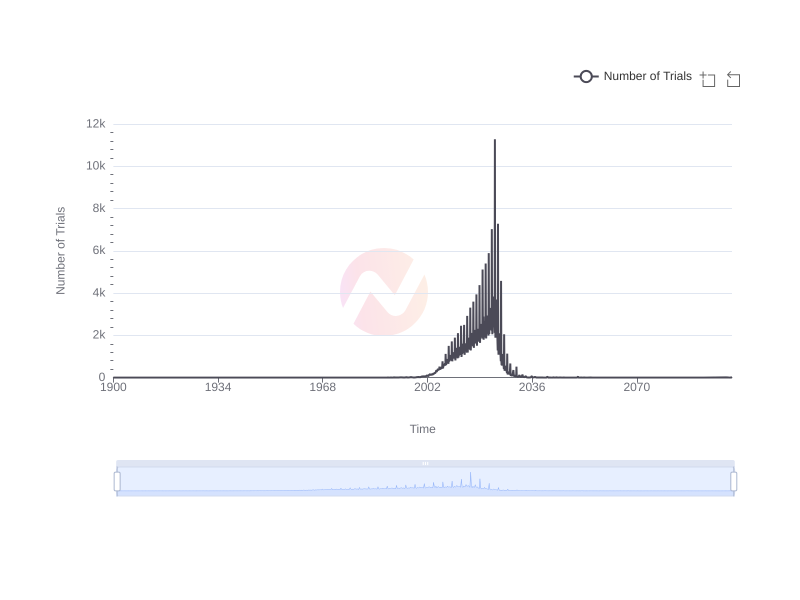
Number of clinical trials by year

Number of clinical trials by year
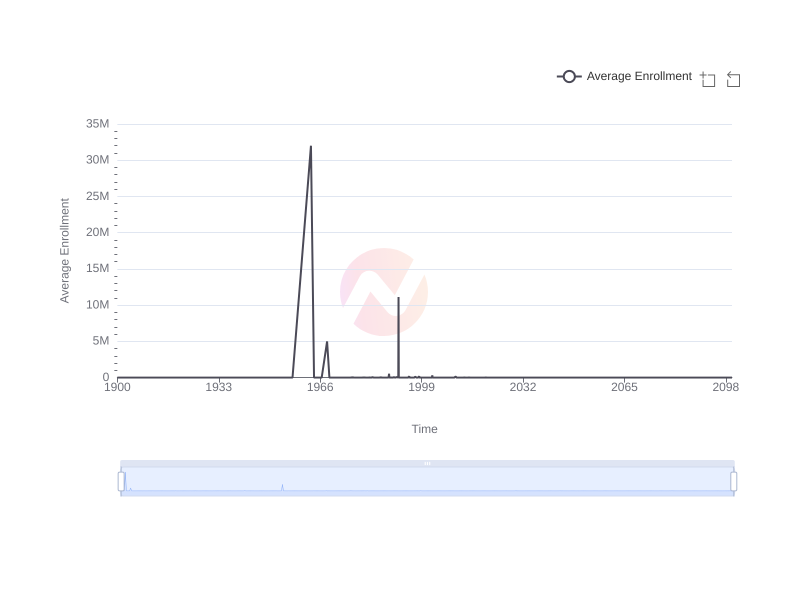
Trend of Clinical Trials Enrollment Over Time
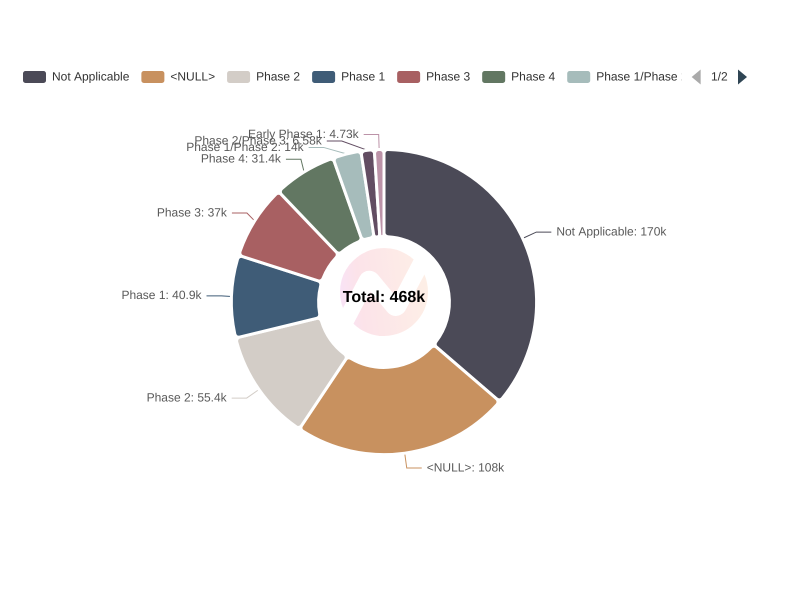
Distribution of Clinical Trials by Phase
Trend of Number of Arms in Clinical Trials Over Time
Trend of Clinical Trials Completion Over Time
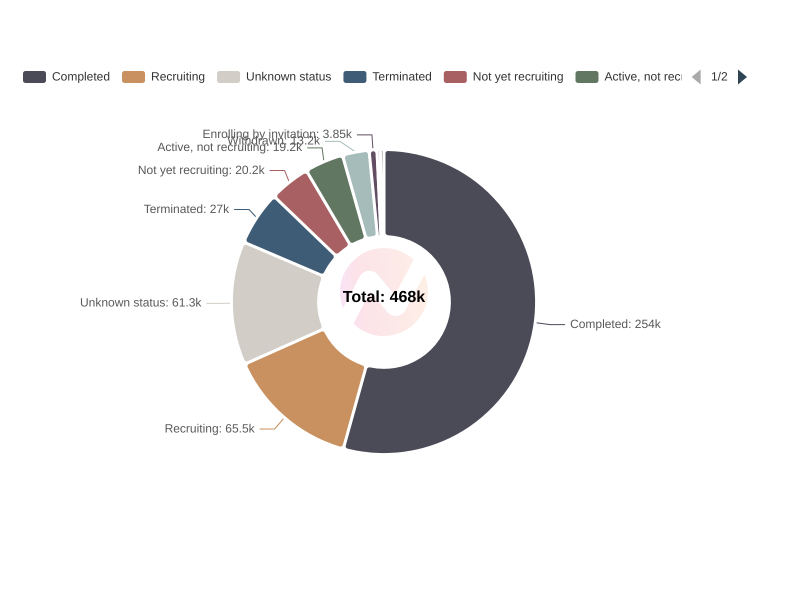
Distribution of Clinical Trials by Overall Status

Trend of Number of Groups in Clinical Trials Over Time
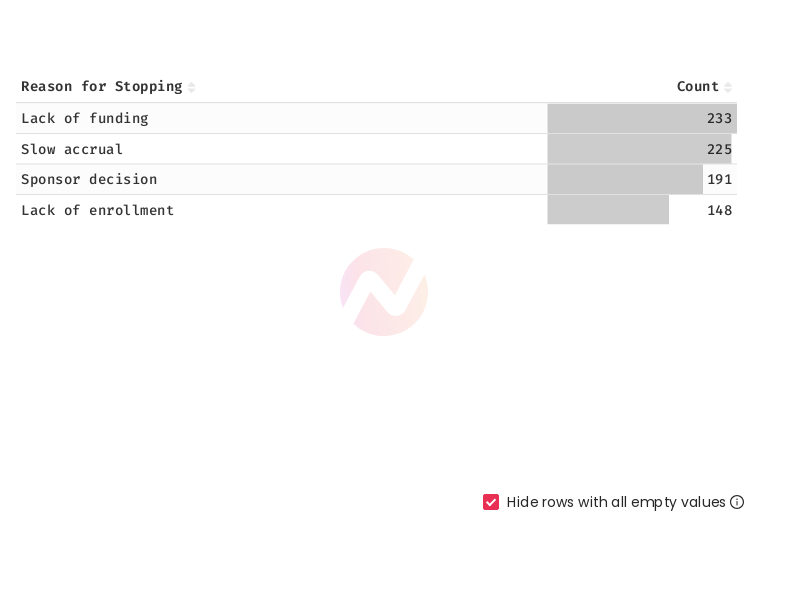
Top 5 Most Common Reasons for Stopping Clinical Trials
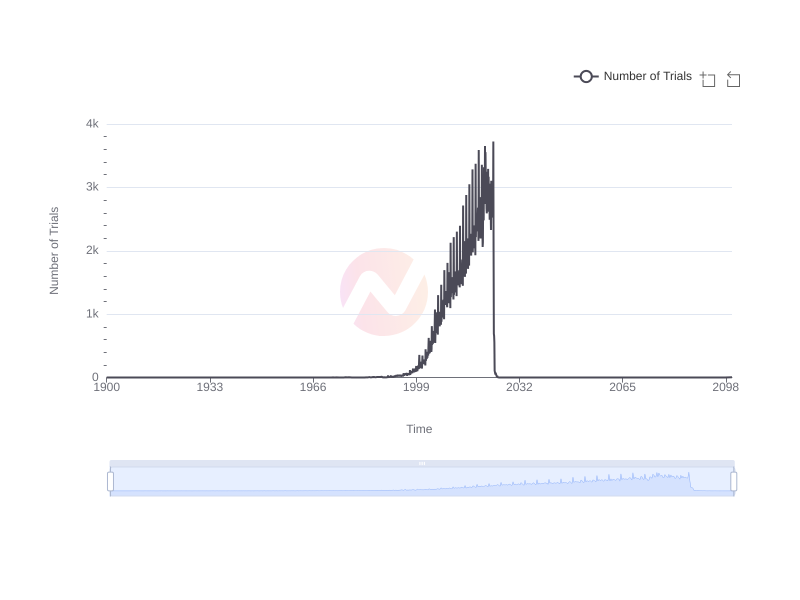
Trend of Clinical Trials Start Dates Over Time
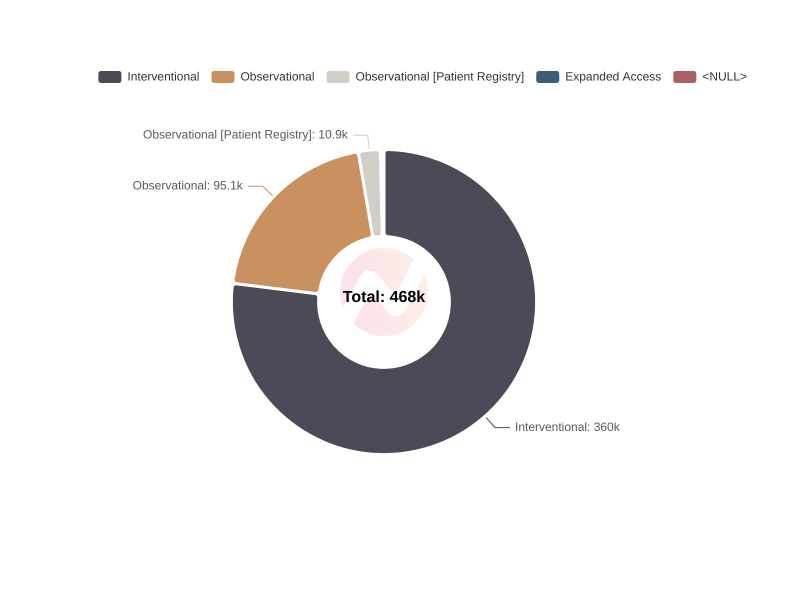
Distribution of Clinical Trials by Study Type

Comparison of Clinical Trials in Canada vs United States Over the Years