| __timestamp | FLEETCOR Technologies, Inc. | Synopsys, Inc. |
|---|---|---|
| Wednesday, January 1, 2014 | 377744000 | 608294000 |
| Thursday, January 1, 2015 | 515047000 | 639504000 |
| Friday, January 1, 2016 | 519413000 | 668330000 |
| Sunday, January 1, 2017 | 671544000 | 746092000 |
| Monday, January 1, 2018 | 571765000 | 885538000 |
| Tuesday, January 1, 2019 | 612016000 | 862108000 |
| Wednesday, January 1, 2020 | 567410000 | 916540000 |
| Friday, January 1, 2021 | 747948000 | 1035479000 |
| Saturday, January 1, 2022 | 893217000 | 1133617000 |
| Sunday, January 1, 2023 | 1034248000 | 1299327000 |
| Monday, January 1, 2024 | 997780000 | 1427838000 |
In pursuit of knowledge
In the ever-evolving landscape of corporate finance, Selling, General, and Administrative (SG&A) expenses serve as a critical indicator of a company's operational efficiency. Over the past decade, Synopsys, Inc. and FLEETCOR Technologies, Inc. have showcased distinct trajectories in their SG&A expenditures. From 2014 to 2023, Synopsys, Inc. has consistently outpaced FLEETCOR, with a notable 113% increase in SG&A costs, peaking at approximately $1.3 billion in 2023. In contrast, FLEETCOR's expenses grew by 174%, reaching around $1 billion in the same year. This divergence highlights Synopsys' strategic investments in growth and innovation, while FLEETCOR's rising costs may reflect its expansion efforts. Interestingly, 2024 data for FLEETCOR remains elusive, leaving room for speculation on its future financial strategies. As these industry giants navigate the complexities of the global market, their SG&A trends offer valuable insights into their operational priorities.
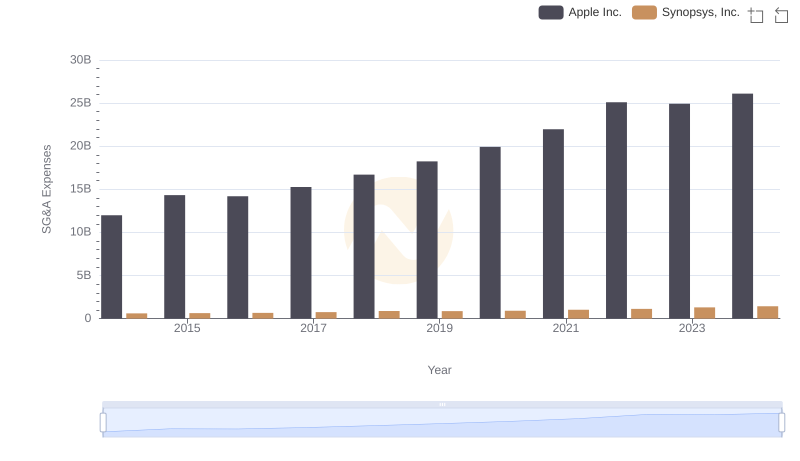
Cost Management Insights: SG&A Expenses for Apple Inc. and Synopsys, Inc.
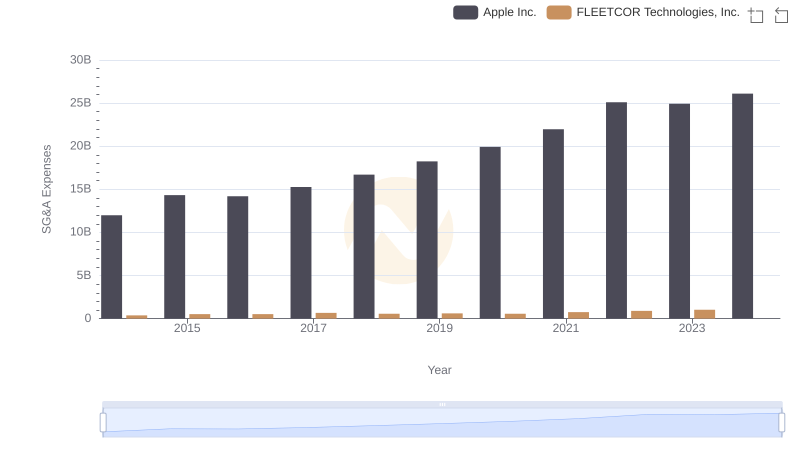
Who Optimizes SG&A Costs Better? Apple Inc. or FLEETCOR Technologies, Inc.
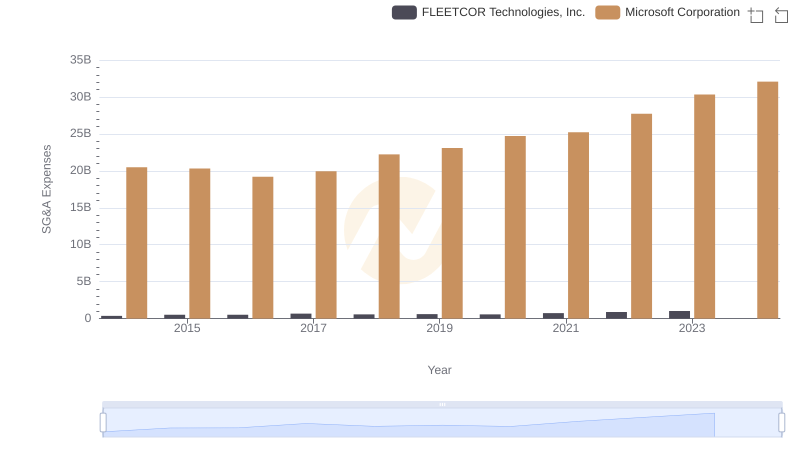
Microsoft Corporation vs FLEETCOR Technologies, Inc.: SG&A Expense Trends
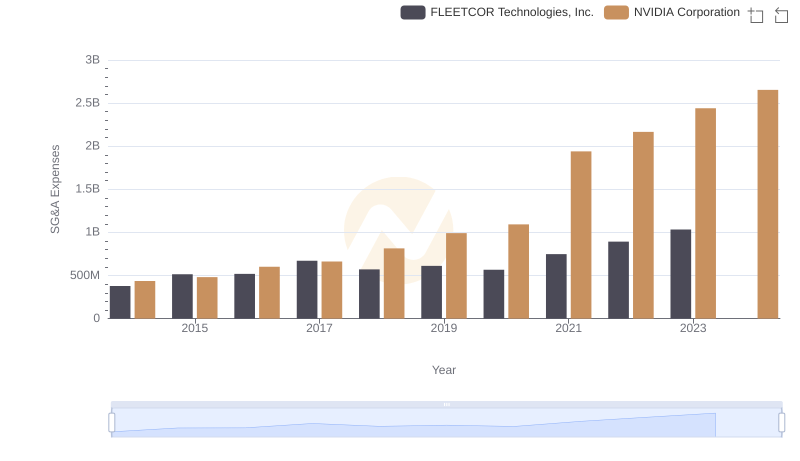
NVIDIA Corporation and FLEETCOR Technologies, Inc.: SG&A Spending Patterns Compared
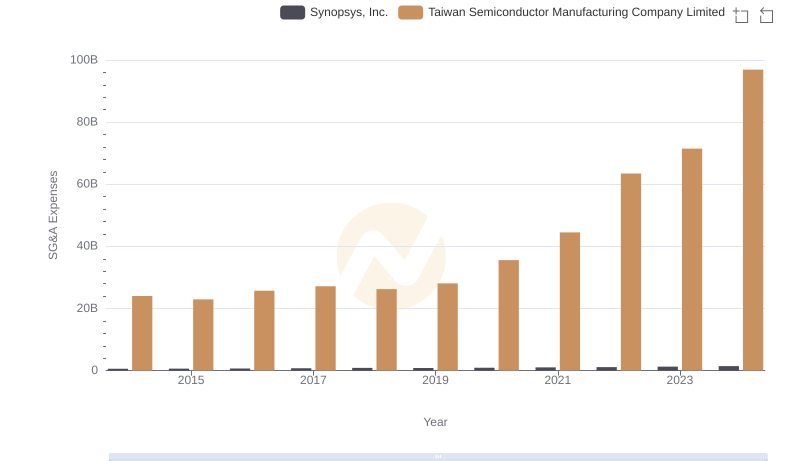
Operational Costs Compared: SG&A Analysis of Taiwan Semiconductor Manufacturing Company Limited and Synopsys, Inc.
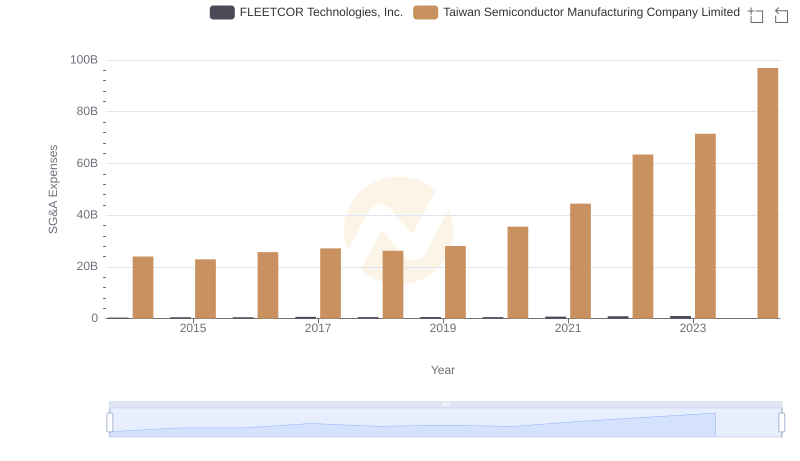
Taiwan Semiconductor Manufacturing Company Limited vs FLEETCOR Technologies, Inc.: SG&A Expense Trends
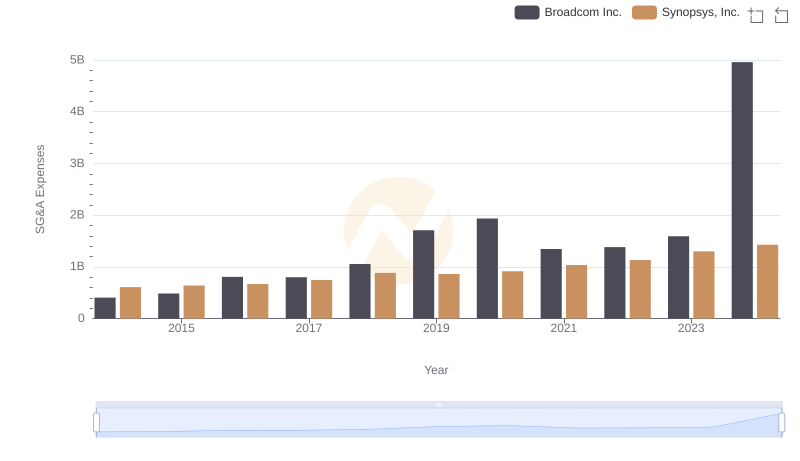
SG&A Efficiency Analysis: Comparing Broadcom Inc. and Synopsys, Inc.
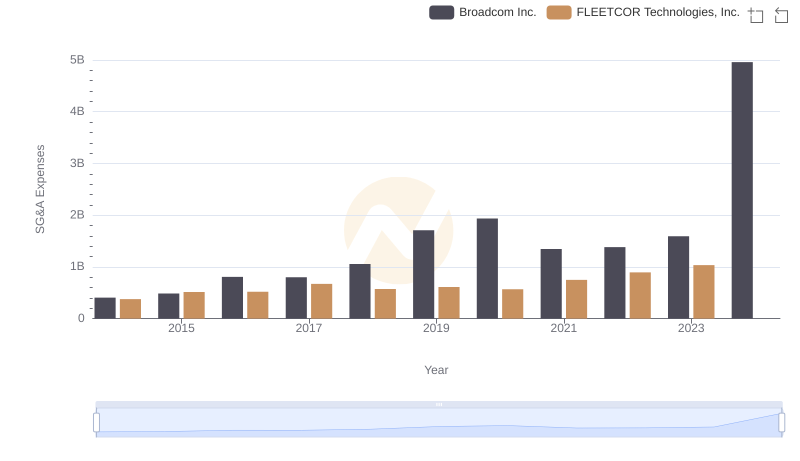
SG&A Efficiency Analysis: Comparing Broadcom Inc. and FLEETCOR Technologies, Inc.
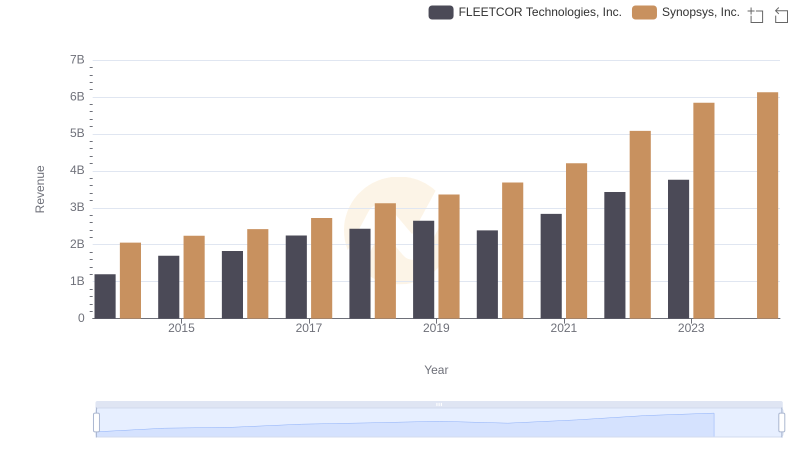
Comparing Revenue Performance: Synopsys, Inc. or FLEETCOR Technologies, Inc.?
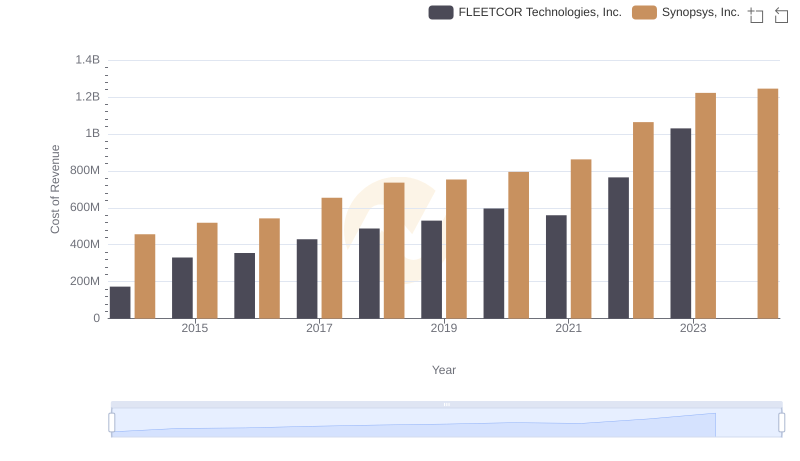
Cost of Revenue Comparison: Synopsys, Inc. vs FLEETCOR Technologies, Inc.
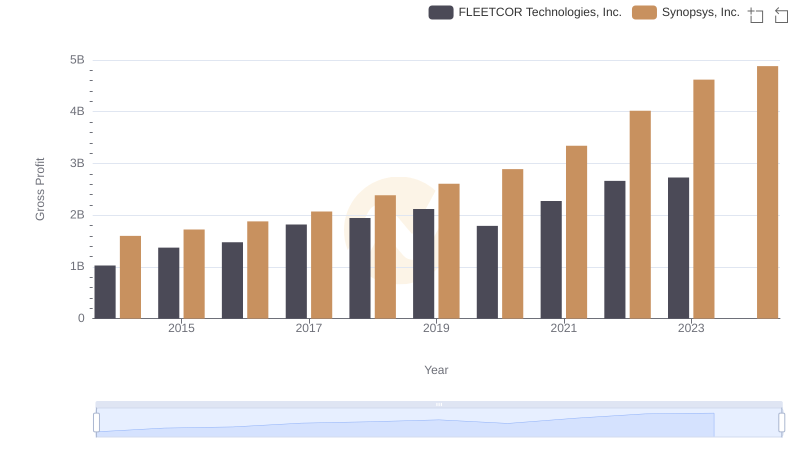
Who Generates Higher Gross Profit? Synopsys, Inc. or FLEETCOR Technologies, Inc.

A Professional Review of EBITDA: Synopsys, Inc. Compared to FLEETCOR Technologies, Inc.