| __timestamp | FLEETCOR Technologies, Inc. | Synopsys, Inc. |
|---|---|---|
| Wednesday, January 1, 2014 | 173337000 | 456885000 |
| Thursday, January 1, 2015 | 331073000 | 518920000 |
| Friday, January 1, 2016 | 355414000 | 542962000 |
| Sunday, January 1, 2017 | 429613000 | 654184000 |
| Monday, January 1, 2018 | 487695000 | 735898000 |
| Tuesday, January 1, 2019 | 530669000 | 752946000 |
| Wednesday, January 1, 2020 | 596363000 | 794690000 |
| Friday, January 1, 2021 | 559819000 | 861777000 |
| Saturday, January 1, 2022 | 764707000 | 1063697000 |
| Sunday, January 1, 2023 | 1030138999 | 1222193000 |
| Monday, January 1, 2024 | 0 | 1245289000 |
Igniting the spark of knowledge
In the ever-evolving landscape of technology and financial services, Synopsys, Inc. and FLEETCOR Technologies, Inc. have emerged as key players. Over the past decade, Synopsys has consistently outpaced FLEETCOR in terms of cost of revenue, with a notable 53% higher average from 2014 to 2023. This trend highlights Synopsys's expansive growth in the software industry, where its cost of revenue peaked at $1.22 billion in 2023. Meanwhile, FLEETCOR, a leader in payment solutions, saw its cost of revenue rise by nearly 500% from 2014 to 2023, reaching $1.03 billion. This growth trajectory underscores FLEETCOR's strategic expansion in the financial sector. However, the data for 2024 is incomplete, leaving room for speculation on future trends. As these companies continue to innovate, their financial strategies will be pivotal in shaping their competitive edge.
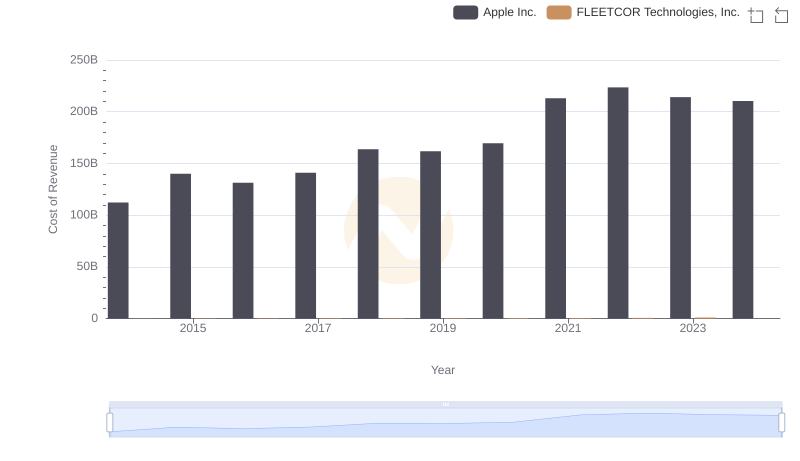
Apple Inc. vs FLEETCOR Technologies, Inc.: Efficiency in Cost of Revenue Explored
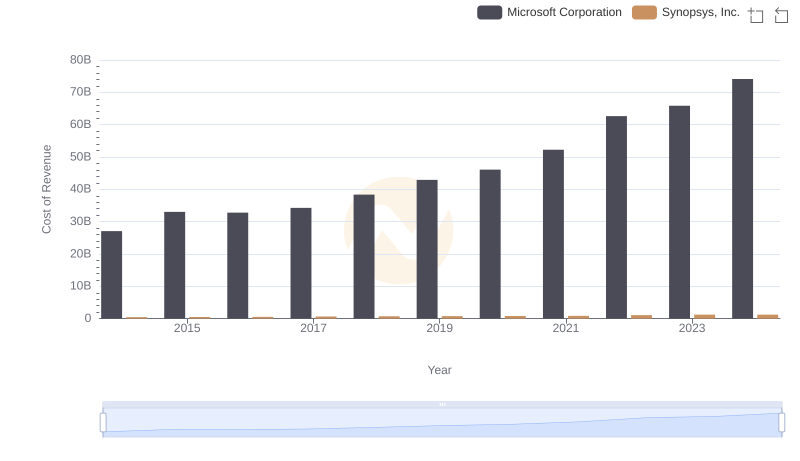
Cost of Revenue: Key Insights for Microsoft Corporation and Synopsys, Inc.
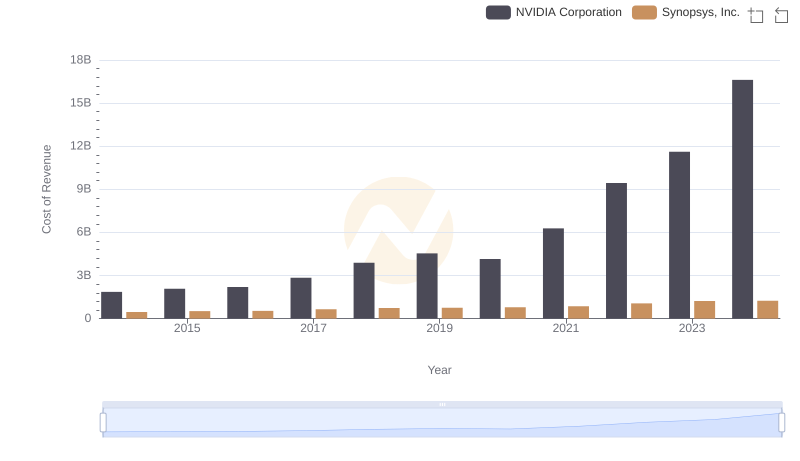
Cost of Revenue Comparison: NVIDIA Corporation vs Synopsys, Inc.
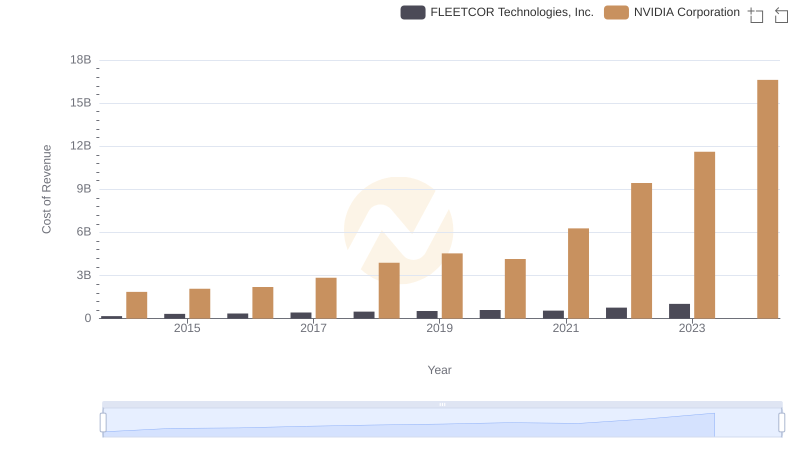
Cost Insights: Breaking Down NVIDIA Corporation and FLEETCOR Technologies, Inc.'s Expenses
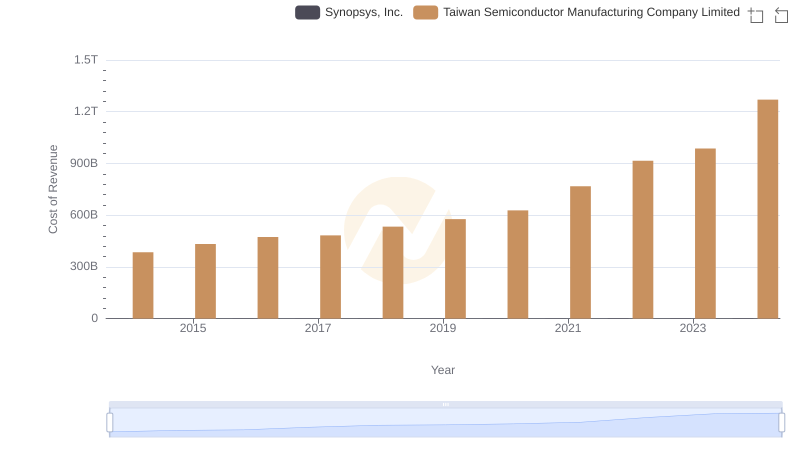
Cost of Revenue Trends: Taiwan Semiconductor Manufacturing Company Limited vs Synopsys, Inc.
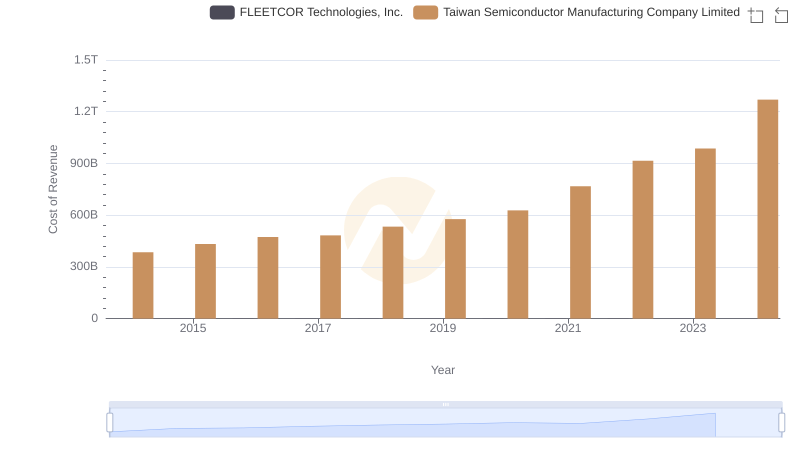
Cost of Revenue Comparison: Taiwan Semiconductor Manufacturing Company Limited vs FLEETCOR Technologies, Inc.
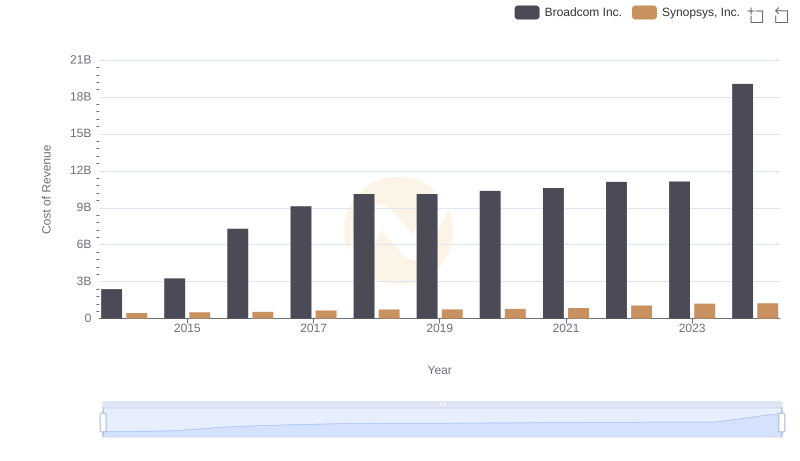
Cost of Revenue Trends: Broadcom Inc. vs Synopsys, Inc.
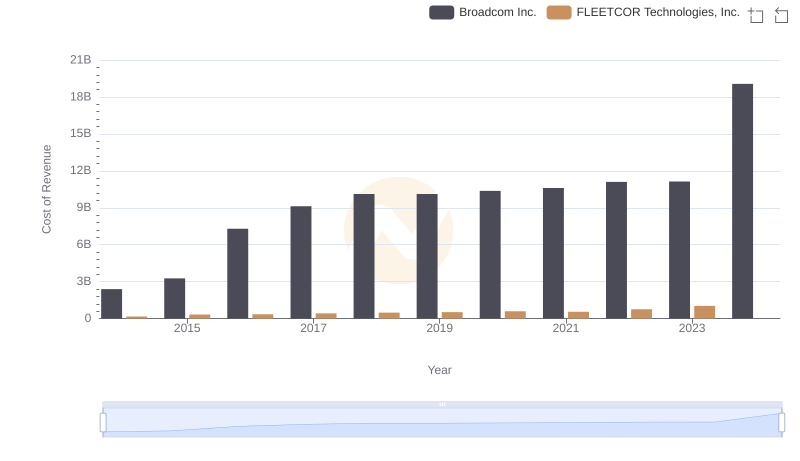
Broadcom Inc. vs FLEETCOR Technologies, Inc.: Efficiency in Cost of Revenue Explored
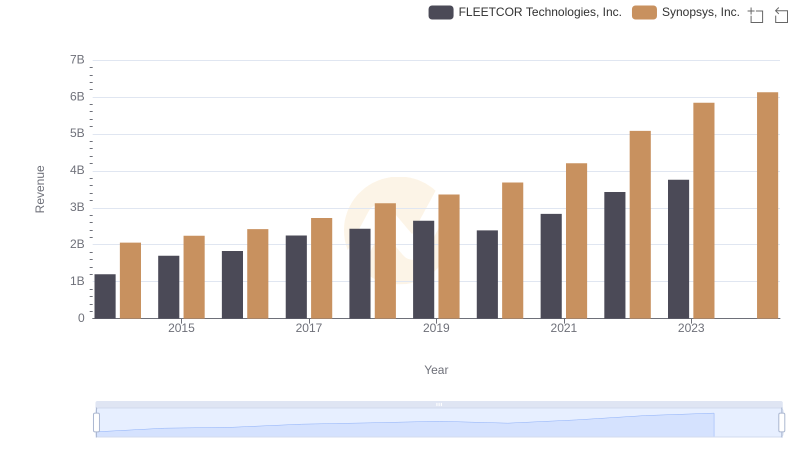
Comparing Revenue Performance: Synopsys, Inc. or FLEETCOR Technologies, Inc.?
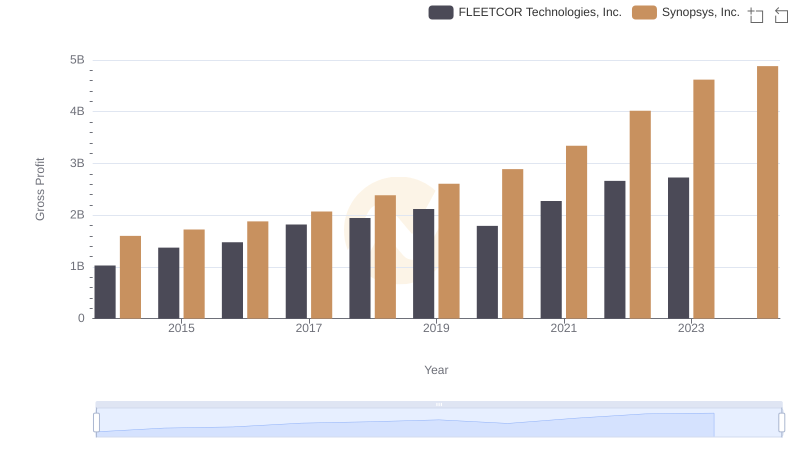
Who Generates Higher Gross Profit? Synopsys, Inc. or FLEETCOR Technologies, Inc.
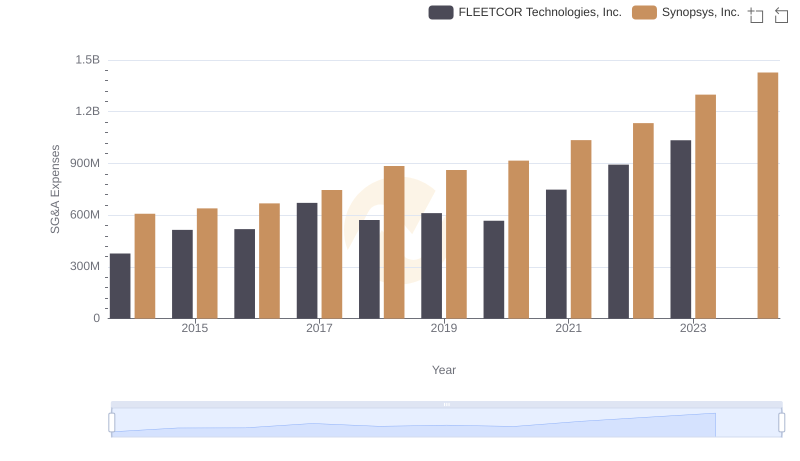
Selling, General, and Administrative Costs: Synopsys, Inc. vs FLEETCOR Technologies, Inc.

A Professional Review of EBITDA: Synopsys, Inc. Compared to FLEETCOR Technologies, Inc.