| __timestamp | FLEETCOR Technologies, Inc. | Synopsys, Inc. |
|---|---|---|
| Wednesday, January 1, 2014 | 669924000 | 441543000 |
| Thursday, January 1, 2015 | 800796000 | 496245000 |
| Friday, January 1, 2016 | 918071000 | 540351000 |
| Sunday, January 1, 2017 | 1321756000 | 584909000 |
| Monday, January 1, 2018 | 1517473000 | 581213000 |
| Tuesday, January 1, 2019 | 1505547000 | 761347000 |
| Wednesday, January 1, 2020 | 1237122000 | 857403000 |
| Friday, January 1, 2021 | 1522895000 | 1101071000 |
| Saturday, January 1, 2022 | 1765920000 | 1435158000 |
| Sunday, January 1, 2023 | 2027494000 | 1647785000 |
| Monday, January 1, 2024 | 2119258000 | 1355711000 |
Igniting the spark of knowledge
In the ever-evolving landscape of technology and financial services, understanding the financial health of industry leaders is crucial. This analysis delves into the EBITDA performance of Synopsys, Inc. and FLEETCOR Technologies, Inc. over the past decade.
From 2014 to 2023, FLEETCOR's EBITDA surged by approximately 203%, peaking in 2023. This growth underscores its robust financial strategy and market adaptability. Meanwhile, Synopsys demonstrated a remarkable 273% increase in EBITDA, reflecting its stronghold in the software industry.
Interestingly, 2023 marked a pivotal year for both companies, with FLEETCOR reaching its highest EBITDA, while Synopsys continued its upward trajectory. However, data for 2024 is incomplete, leaving room for speculation on future trends.
This comparative insight not only highlights the financial prowess of these giants but also offers a glimpse into their strategic maneuvers in a competitive market.
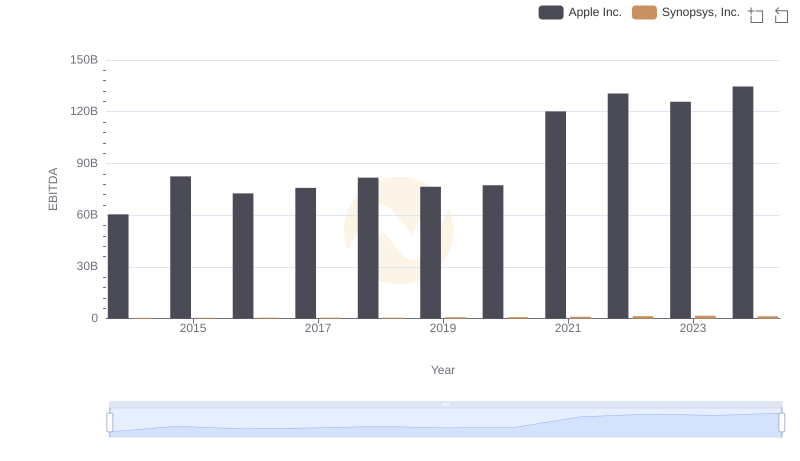
Professional EBITDA Benchmarking: Apple Inc. vs Synopsys, Inc.
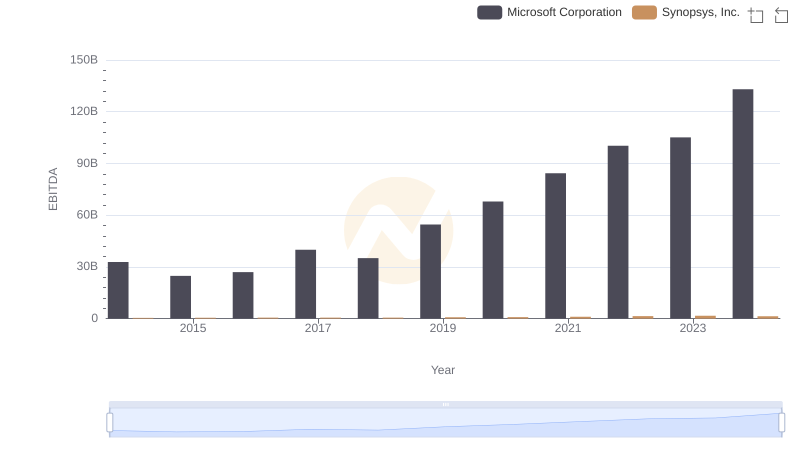
Comprehensive EBITDA Comparison: Microsoft Corporation vs Synopsys, Inc.
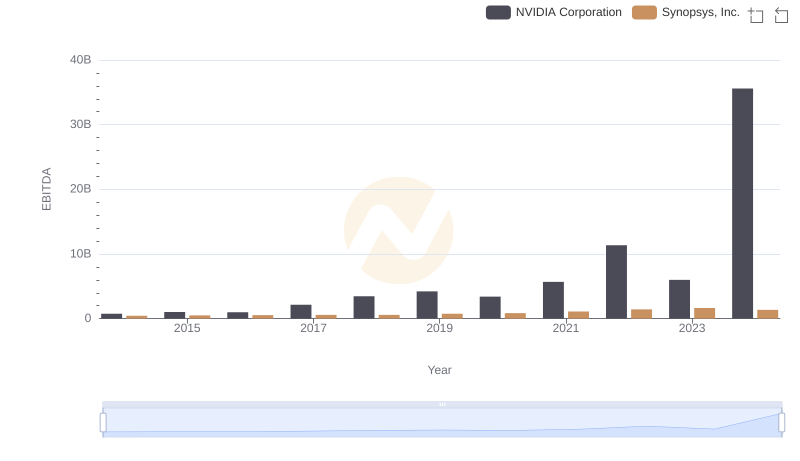
EBITDA Performance Review: NVIDIA Corporation vs Synopsys, Inc.
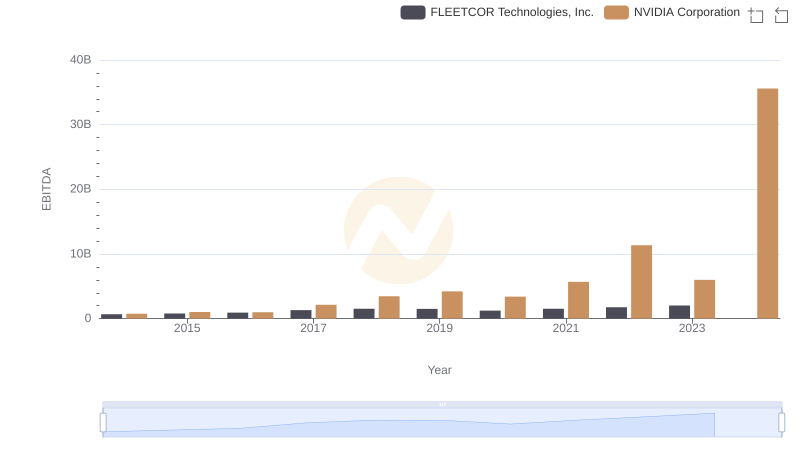
NVIDIA Corporation and FLEETCOR Technologies, Inc.: A Detailed Examination of EBITDA Performance
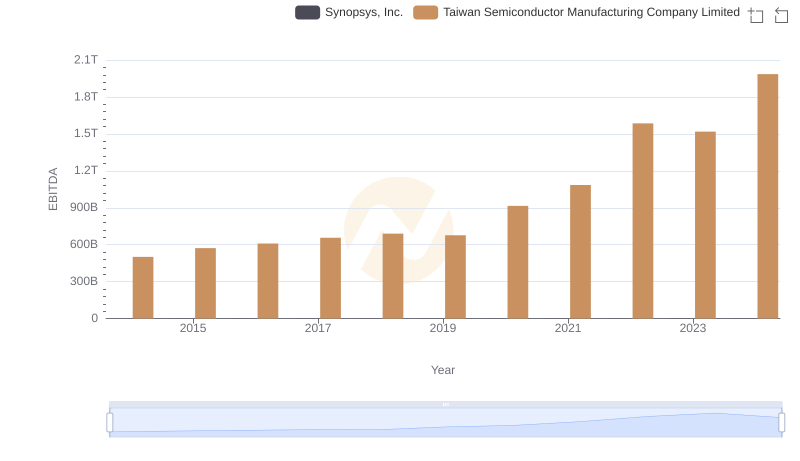
EBITDA Performance Review: Taiwan Semiconductor Manufacturing Company Limited vs Synopsys, Inc.
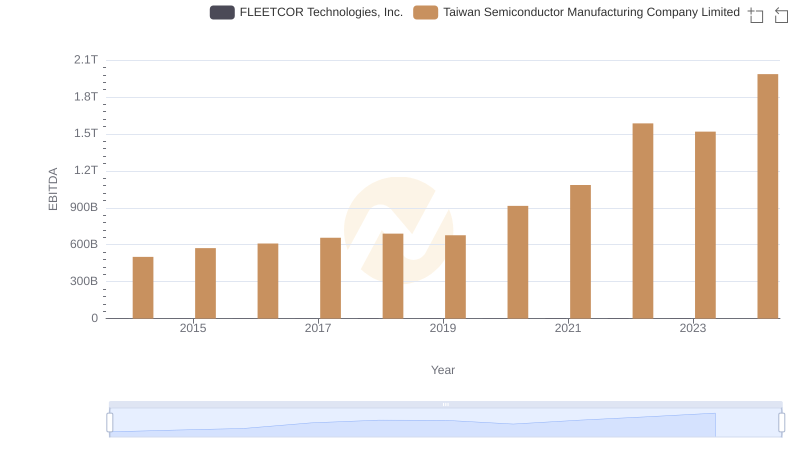
EBITDA Performance Review: Taiwan Semiconductor Manufacturing Company Limited vs FLEETCOR Technologies, Inc.
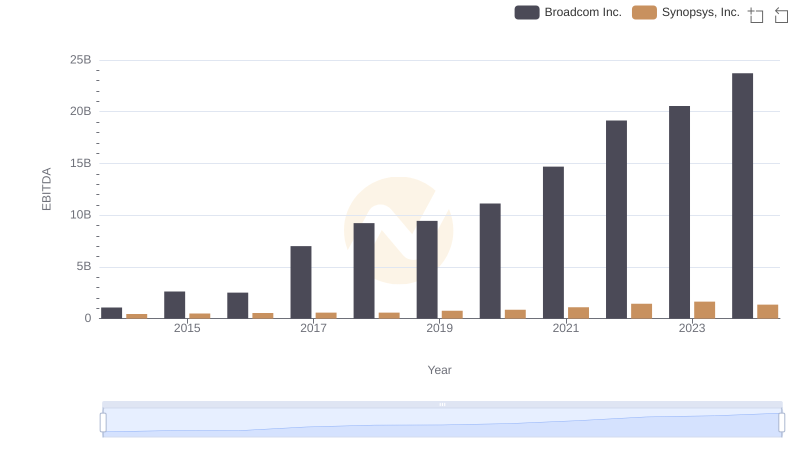
Broadcom Inc. vs Synopsys, Inc.: In-Depth EBITDA Performance Comparison
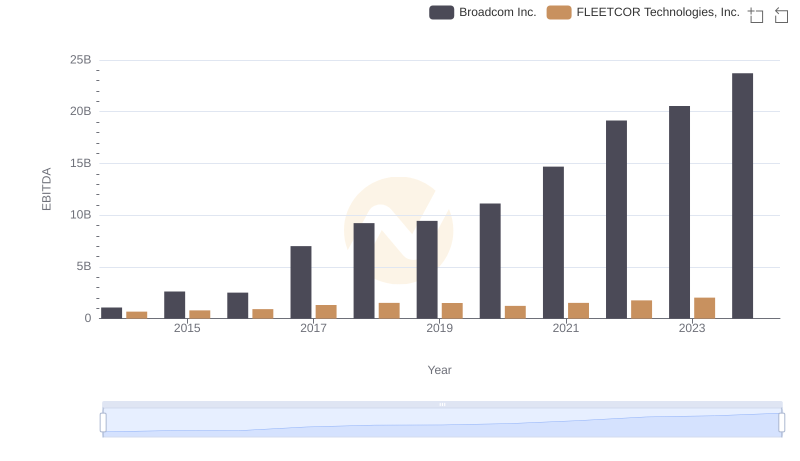
Comparative EBITDA Analysis: Broadcom Inc. vs FLEETCOR Technologies, Inc.
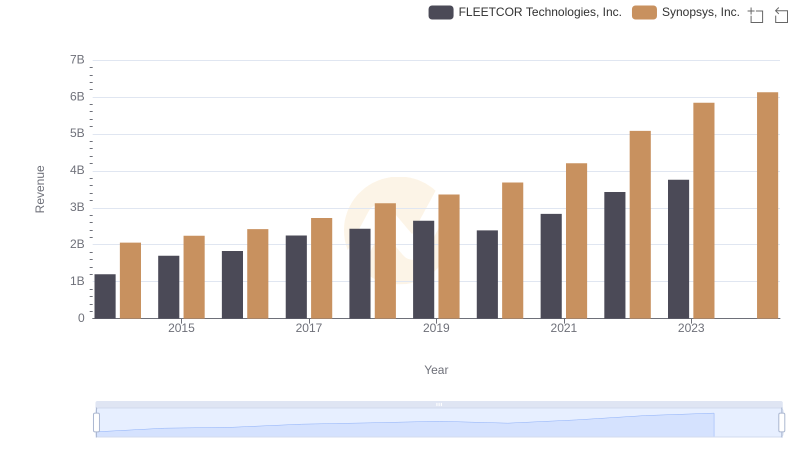
Comparing Revenue Performance: Synopsys, Inc. or FLEETCOR Technologies, Inc.?
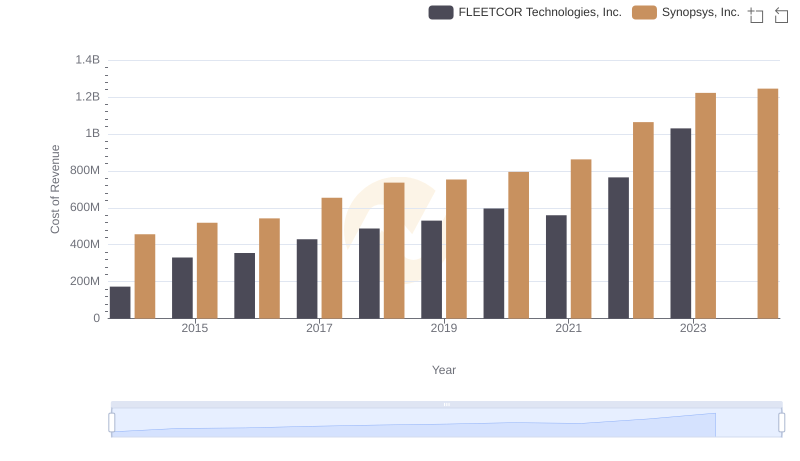
Cost of Revenue Comparison: Synopsys, Inc. vs FLEETCOR Technologies, Inc.
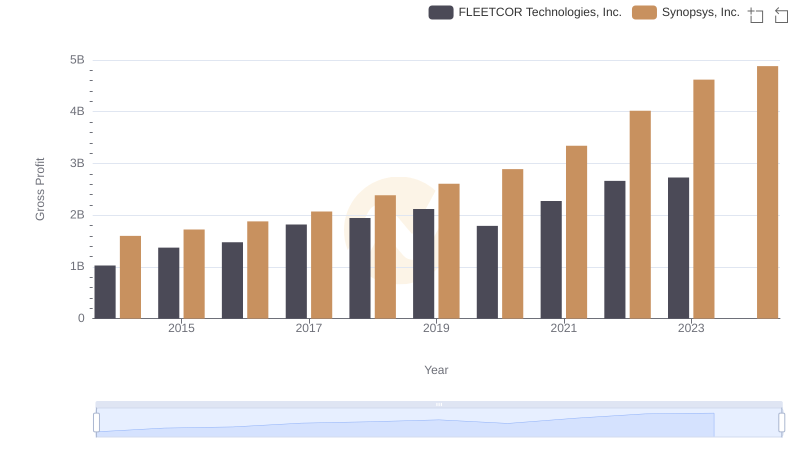
Who Generates Higher Gross Profit? Synopsys, Inc. or FLEETCOR Technologies, Inc.
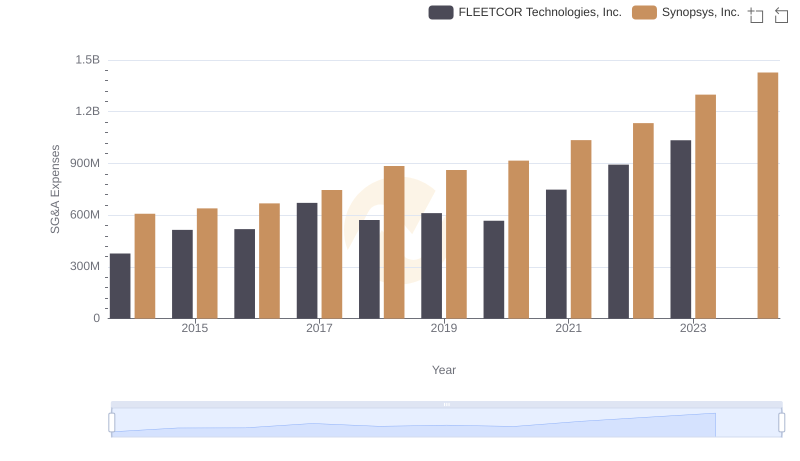
Selling, General, and Administrative Costs: Synopsys, Inc. vs FLEETCOR Technologies, Inc.