| __timestamp | Oracle Corporation | ServiceNow, Inc. |
|---|---|---|
| Wednesday, January 1, 2014 | 6175000000 | 148258000 |
| Thursday, January 1, 2015 | 5524000000 | 217389000 |
| Friday, January 1, 2016 | 6346000000 | 285239000 |
| Sunday, January 1, 2017 | 6153000000 | 377518000 |
| Monday, January 1, 2018 | 6084000000 | 529501000 |
| Tuesday, January 1, 2019 | 6026000000 | 748369000 |
| Wednesday, January 1, 2020 | 6067000000 | 1024327000 |
| Friday, January 1, 2021 | 6527000000 | 1397000000 |
| Saturday, January 1, 2022 | 7694000000 | 1768000000 |
| Sunday, January 1, 2023 | 9415000000 | 2124000000 |
| Monday, January 1, 2024 | 8915000000 | 2543000000 |
Unveiling the hidden dimensions of data
In the ever-evolving tech landscape, research and development (R&D) expenses are a key indicator of a company's commitment to innovation. Over the past decade, Oracle Corporation and ServiceNow, Inc. have demonstrated contrasting trajectories in their R&D investments.
Oracle, a stalwart in enterprise software, has consistently invested in R&D, with a notable 52% increase from 2014 to 2023. This growth underscores Oracle's dedication to maintaining its competitive edge. In contrast, ServiceNow, a rising star in cloud computing, has seen its R&D expenses skyrocket by over 1,600% during the same period, reflecting its aggressive expansion strategy.
By 2023, ServiceNow's R&D spending reached nearly 23% of Oracle's, up from just 2% in 2014. This remarkable growth highlights ServiceNow's rapid ascent in the tech industry, as it continues to challenge established giants like Oracle.
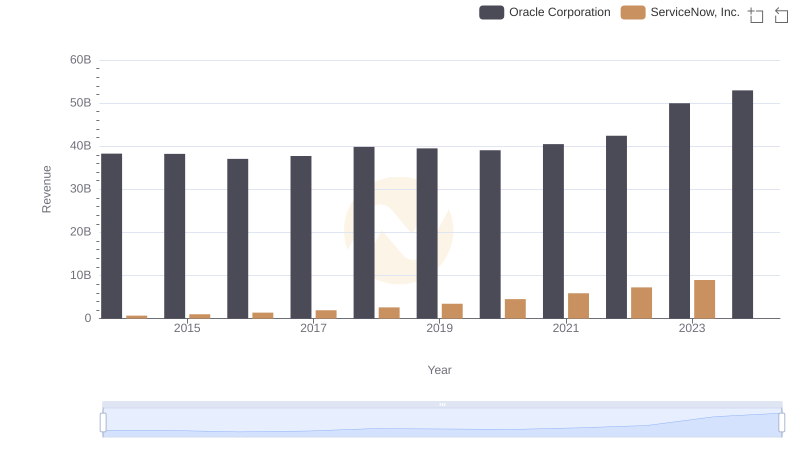
Oracle Corporation vs ServiceNow, Inc.: Annual Revenue Growth Compared
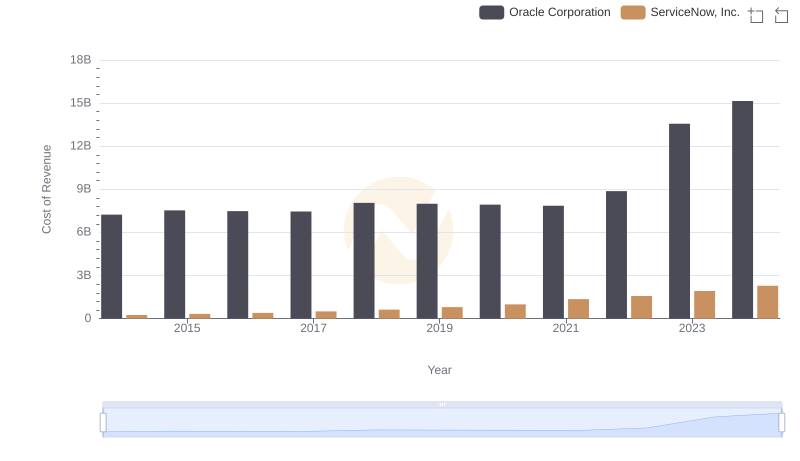
Cost of Revenue Comparison: Oracle Corporation vs ServiceNow, Inc.
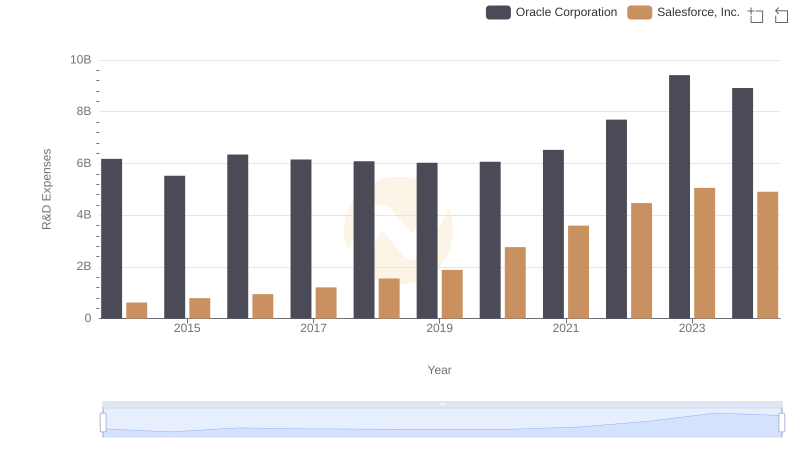
R&D Spending Showdown: Oracle Corporation vs Salesforce, Inc.
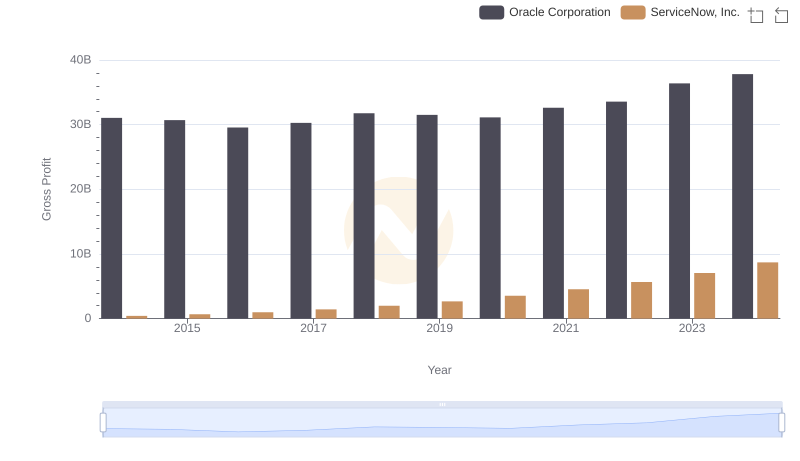
Who Generates Higher Gross Profit? Oracle Corporation or ServiceNow, Inc.
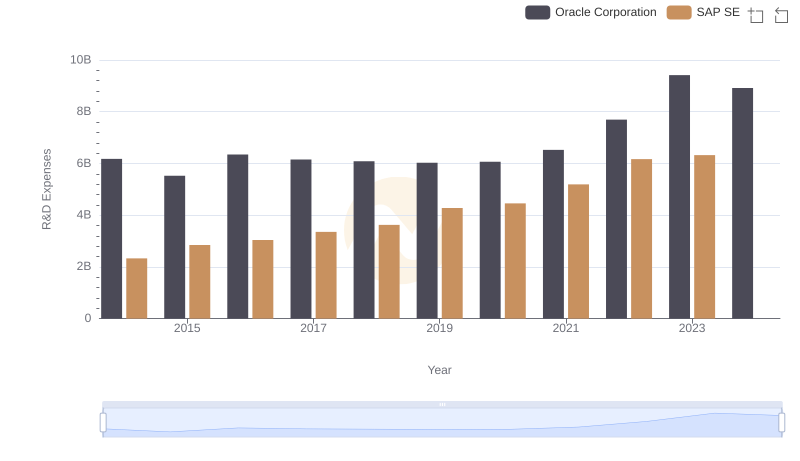
Research and Development: Comparing Key Metrics for Oracle Corporation and SAP SE
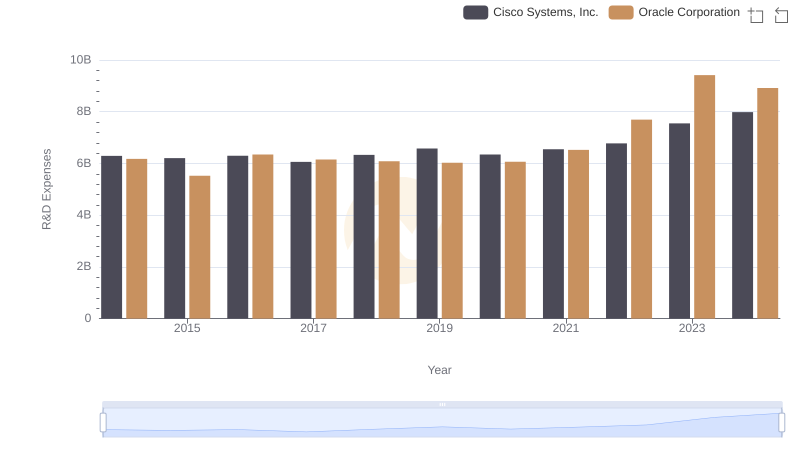
Research and Development Expenses Breakdown: Oracle Corporation vs Cisco Systems, Inc.
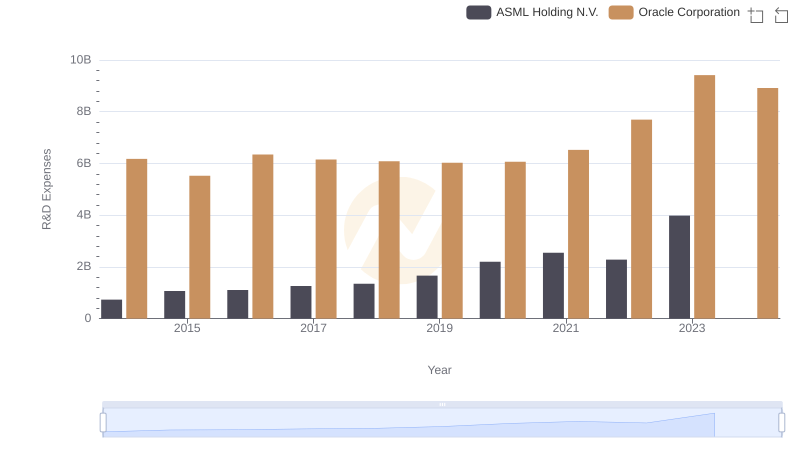
R&D Spending Showdown: Oracle Corporation vs ASML Holding N.V.
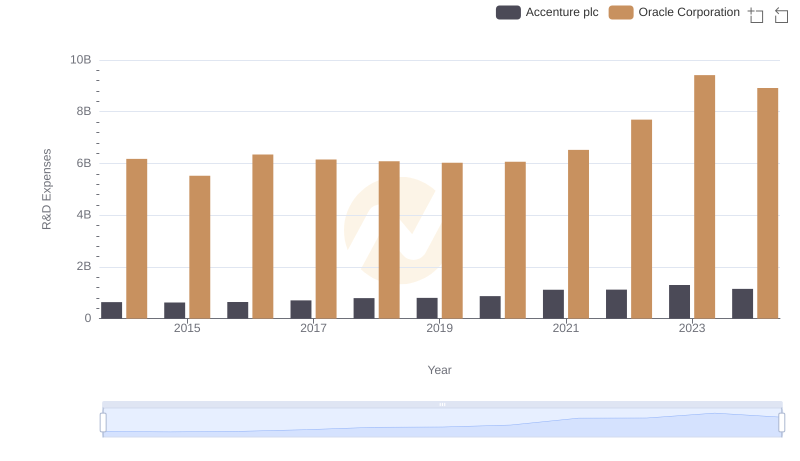
R&D Spending Showdown: Oracle Corporation vs Accenture plc
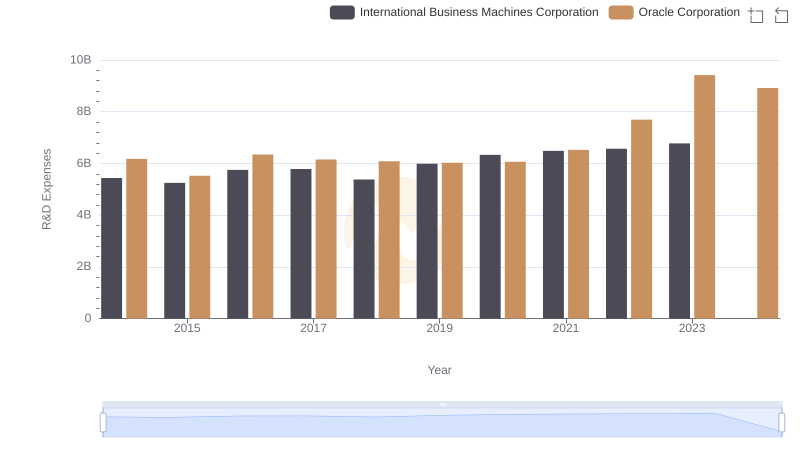
R&D Insights: How Oracle Corporation and International Business Machines Corporation Allocate Funds
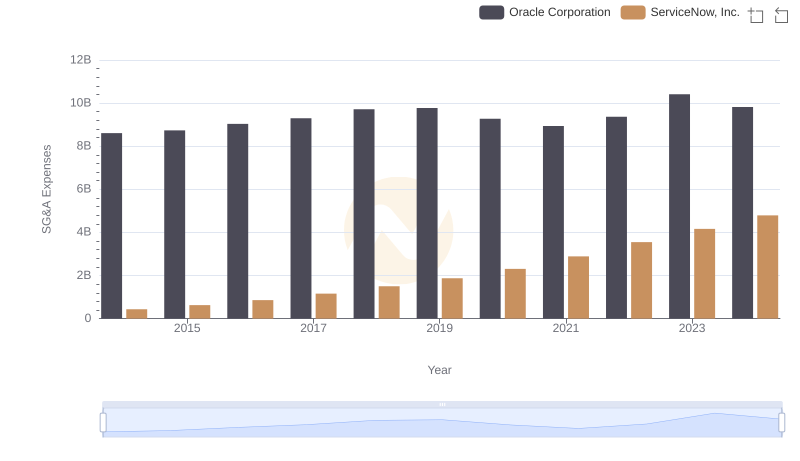
Operational Costs Compared: SG&A Analysis of Oracle Corporation and ServiceNow, Inc.
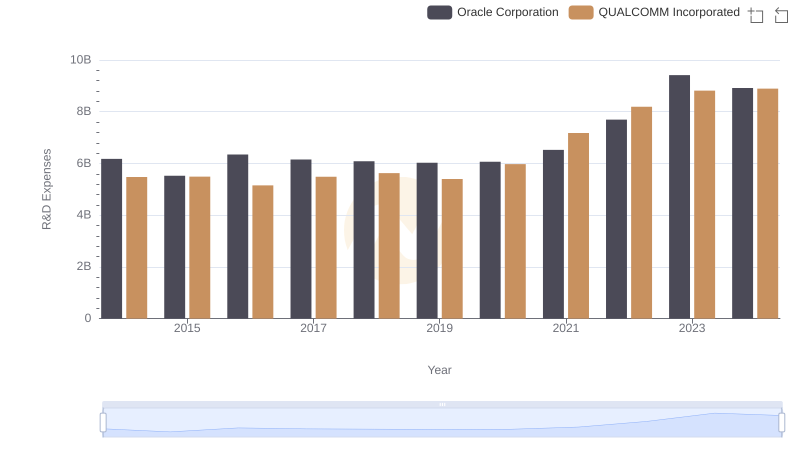
Research and Development Investment: Oracle Corporation vs QUALCOMM Incorporated
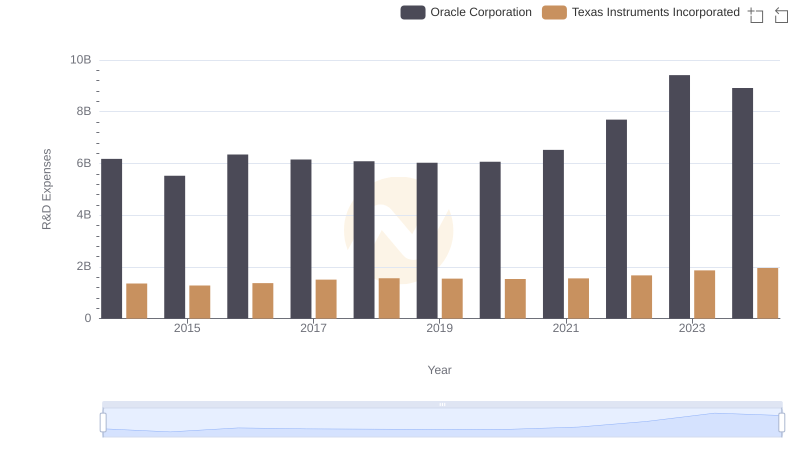
Analyzing R&D Budgets: Oracle Corporation vs Texas Instruments Incorporated