| __timestamp | Oracle Corporation | ServiceNow, Inc. |
|---|---|---|
| Wednesday, January 1, 2014 | 38275000000 | 682563000 |
| Thursday, January 1, 2015 | 38226000000 | 1005480000 |
| Friday, January 1, 2016 | 37047000000 | 1390513000 |
| Sunday, January 1, 2017 | 37728000000 | 1933026000 |
| Monday, January 1, 2018 | 39831000000 | 2608816000 |
| Tuesday, January 1, 2019 | 39506000000 | 3460437000 |
| Wednesday, January 1, 2020 | 39068000000 | 4519484000 |
| Friday, January 1, 2021 | 40479000000 | 5896000000 |
| Saturday, January 1, 2022 | 42440000000 | 7245000000 |
| Sunday, January 1, 2023 | 49954000000 | 8971000000 |
| Monday, January 1, 2024 | 52961000000 | 10984000000 |
Infusing magic into the data realm
In the ever-evolving landscape of technology, Oracle Corporation and ServiceNow, Inc. have emerged as significant players, each carving out a unique niche. Over the past decade, Oracle's revenue has shown a steady increase, growing by approximately 38% from 2014 to 2024. Meanwhile, ServiceNow has experienced a remarkable surge, with its revenue skyrocketing by over 1,500% during the same period. This stark contrast highlights the dynamic nature of the tech industry, where established giants like Oracle continue to expand, while newer entrants like ServiceNow rapidly scale their operations.
Oracle's consistent growth reflects its robust enterprise solutions and strategic acquisitions, while ServiceNow's exponential rise underscores the increasing demand for cloud-based workflow automation. As we look to the future, these trends suggest a continued evolution in the tech sector, driven by innovation and adaptability.
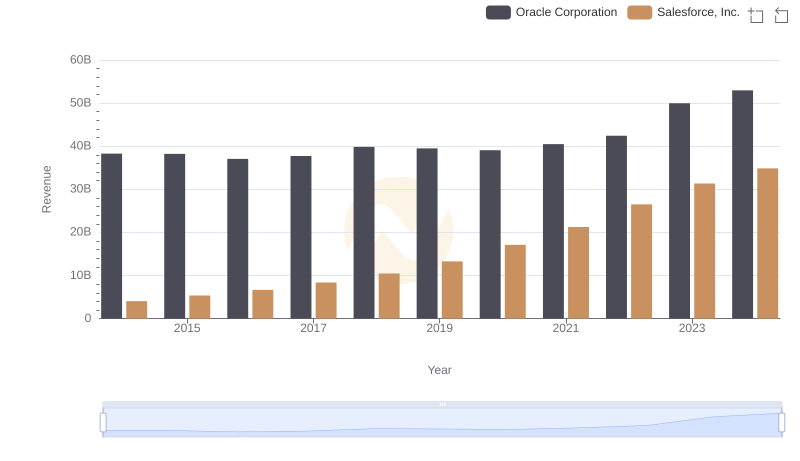
Annual Revenue Comparison: Oracle Corporation vs Salesforce, Inc.
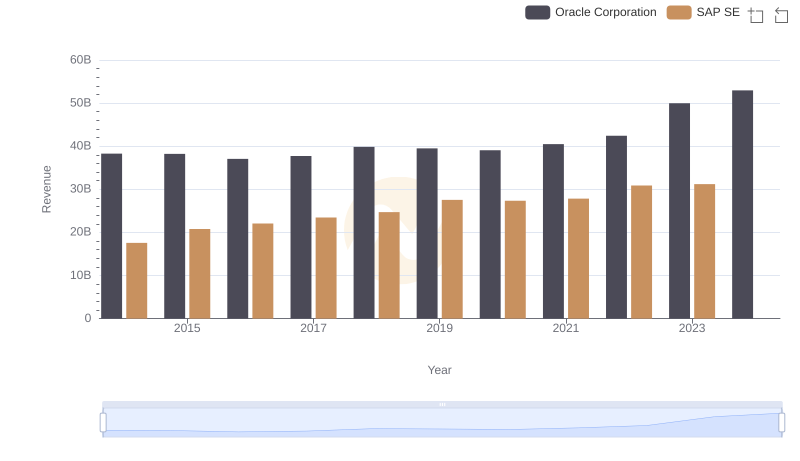
Comparing Revenue Performance: Oracle Corporation or SAP SE?
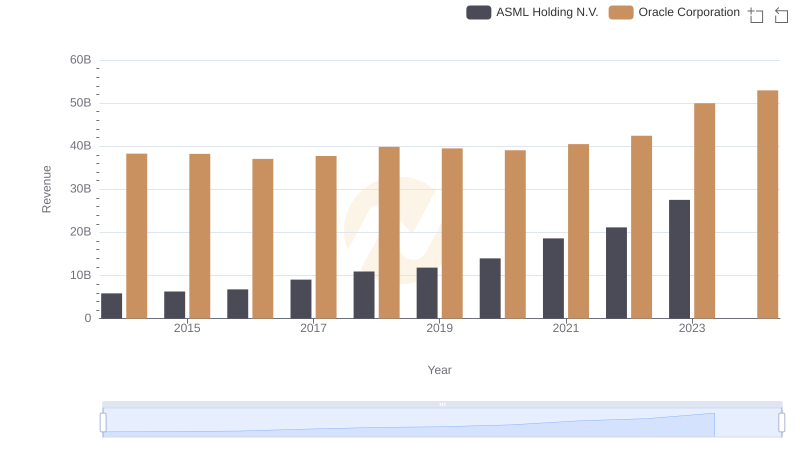
Oracle Corporation vs ASML Holding N.V.: Examining Key Revenue Metrics
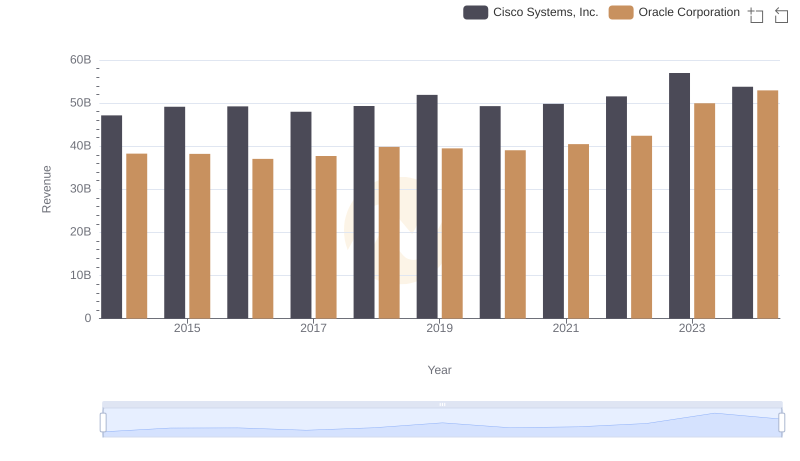
Comparing Revenue Performance: Oracle Corporation or Cisco Systems, Inc.?
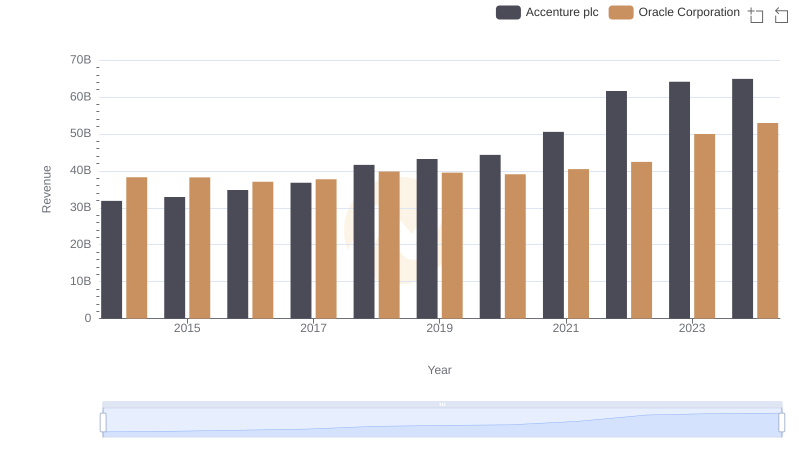
Annual Revenue Comparison: Oracle Corporation vs Accenture plc
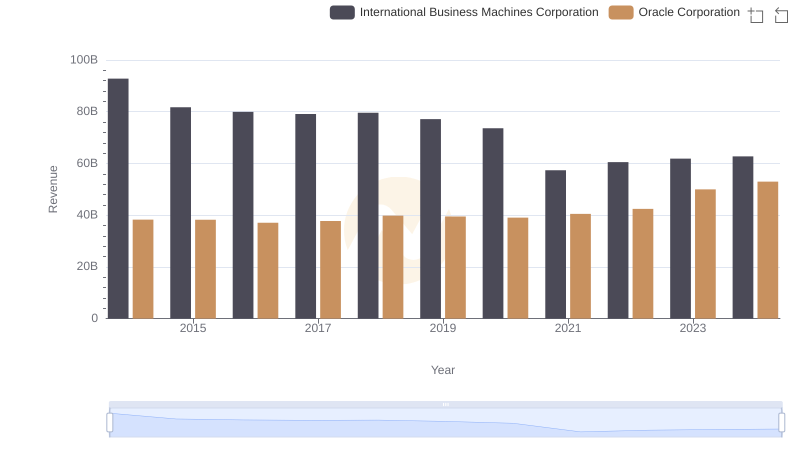
Oracle Corporation vs International Business Machines Corporation: Examining Key Revenue Metrics
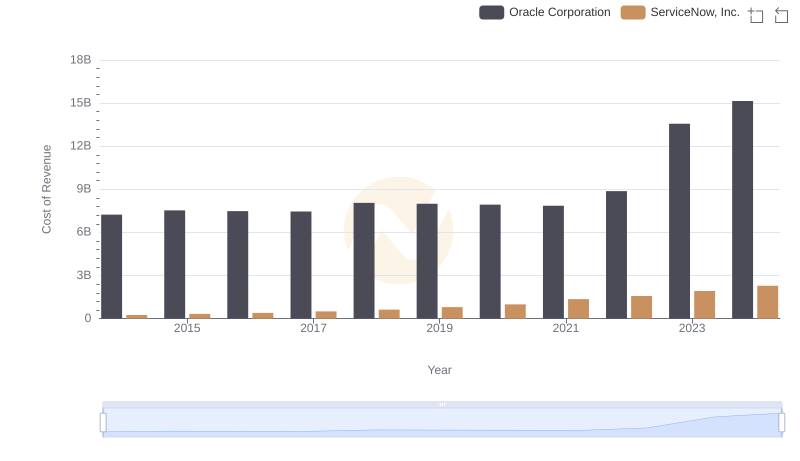
Cost of Revenue Comparison: Oracle Corporation vs ServiceNow, Inc.
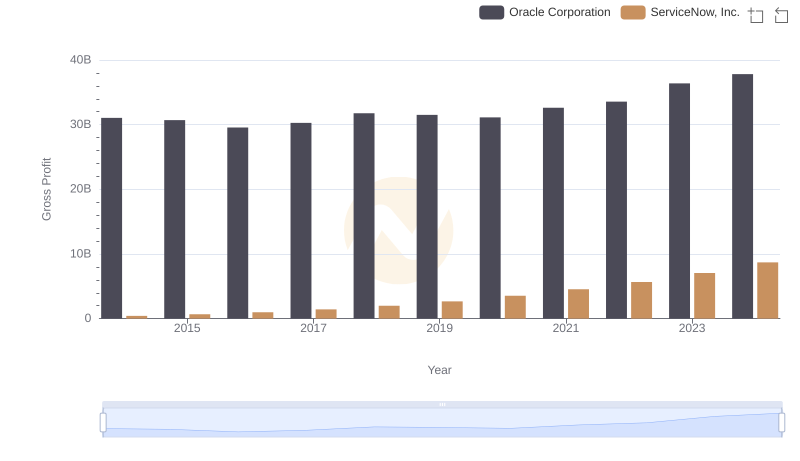
Who Generates Higher Gross Profit? Oracle Corporation or ServiceNow, Inc.
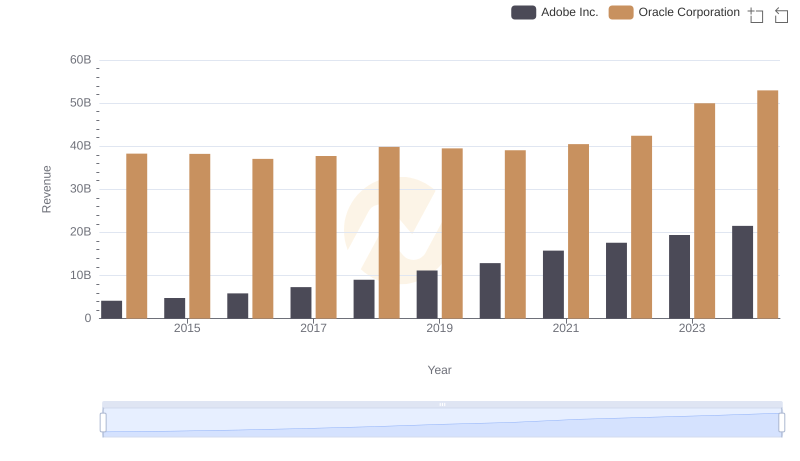
Breaking Down Revenue Trends: Oracle Corporation vs Adobe Inc.
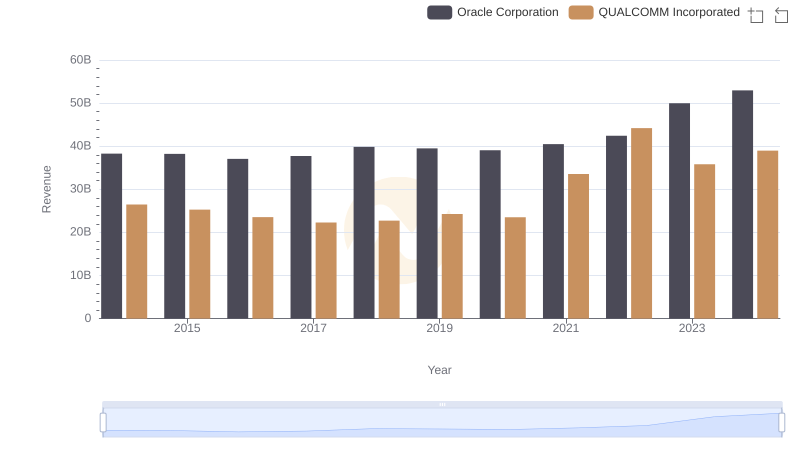
Oracle Corporation and QUALCOMM Incorporated: A Comprehensive Revenue Analysis
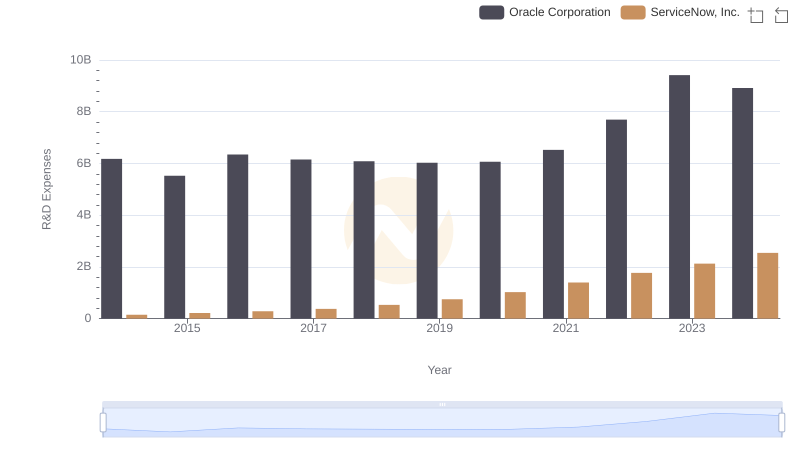
Research and Development Expenses Breakdown: Oracle Corporation vs ServiceNow, Inc.
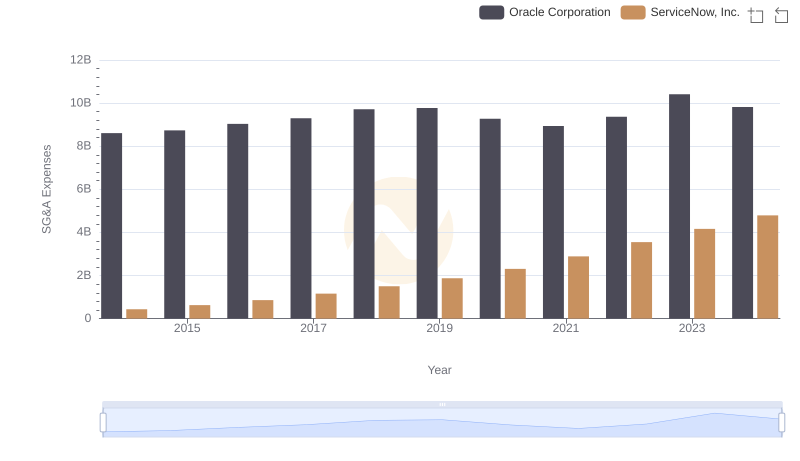
Operational Costs Compared: SG&A Analysis of Oracle Corporation and ServiceNow, Inc.