| __timestamp | Oracle Corporation | ServiceNow, Inc. |
|---|---|---|
| Wednesday, January 1, 2014 | 7236000000 | 248776000 |
| Thursday, January 1, 2015 | 7532000000 | 329413000 |
| Friday, January 1, 2016 | 7479000000 | 398682000 |
| Sunday, January 1, 2017 | 7452000000 | 499772000 |
| Monday, January 1, 2018 | 8060000000 | 622658000 |
| Tuesday, January 1, 2019 | 7995000000 | 796645000 |
| Wednesday, January 1, 2020 | 7938000000 | 987113000 |
| Friday, January 1, 2021 | 7855000000 | 1353000000 |
| Saturday, January 1, 2022 | 8877000000 | 1573000000 |
| Sunday, January 1, 2023 | 13564000000 | 1921000000 |
| Monday, January 1, 2024 | 15143000000 | 2287000000 |
Igniting the spark of knowledge
In the ever-evolving tech industry, understanding cost structures is crucial. This chart provides a decade-long comparison of the cost of revenue for Oracle Corporation and ServiceNow, Inc., from 2014 to 2024. Oracle, a stalwart in enterprise software, consistently shows a higher cost of revenue, peaking at approximately $15.1 billion in 2024. This represents a 109% increase from 2014. In contrast, ServiceNow, a leader in cloud-based solutions, exhibits a more dynamic growth trajectory, with its cost of revenue surging by over 800% during the same period, reaching around $2.3 billion in 2024.
This analysis highlights the contrasting strategies and market dynamics of these two tech giants.
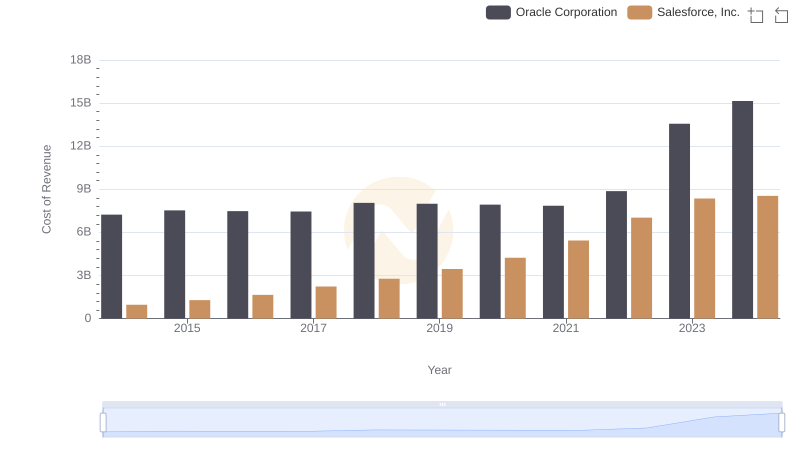
Analyzing Cost of Revenue: Oracle Corporation and Salesforce, Inc.
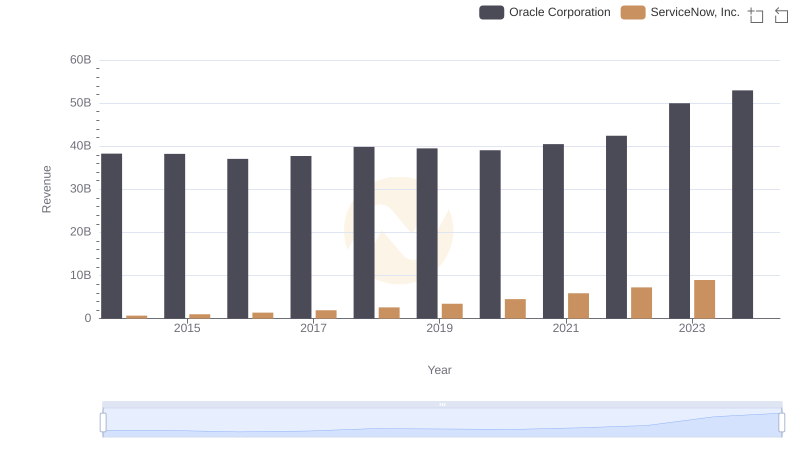
Oracle Corporation vs ServiceNow, Inc.: Annual Revenue Growth Compared
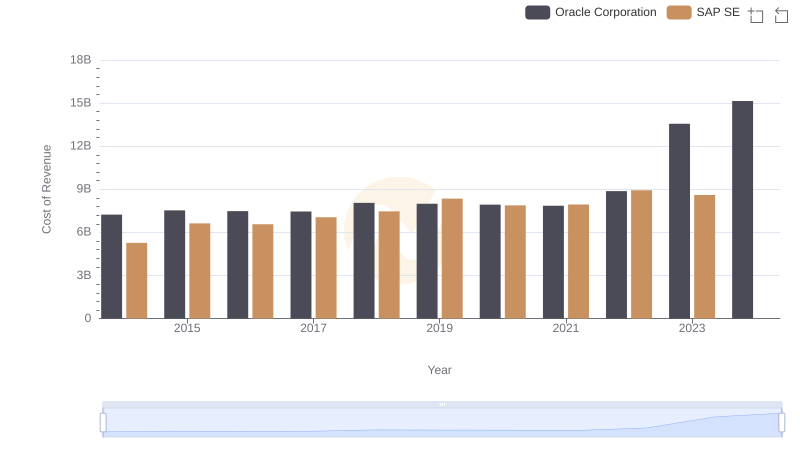
Cost of Revenue Trends: Oracle Corporation vs SAP SE
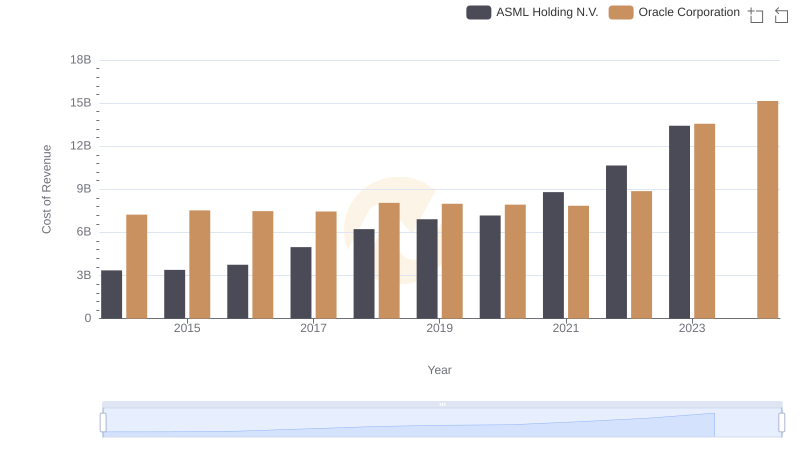
Comparing Cost of Revenue Efficiency: Oracle Corporation vs ASML Holding N.V.
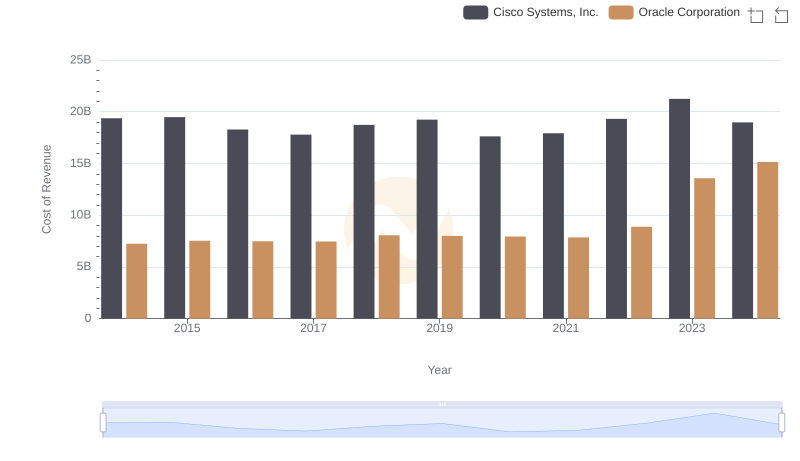
Cost of Revenue Trends: Oracle Corporation vs Cisco Systems, Inc.
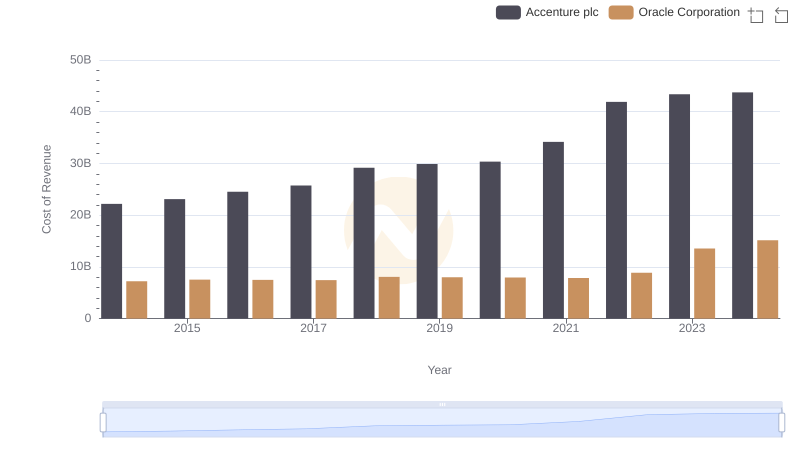
Cost Insights: Breaking Down Oracle Corporation and Accenture plc's Expenses
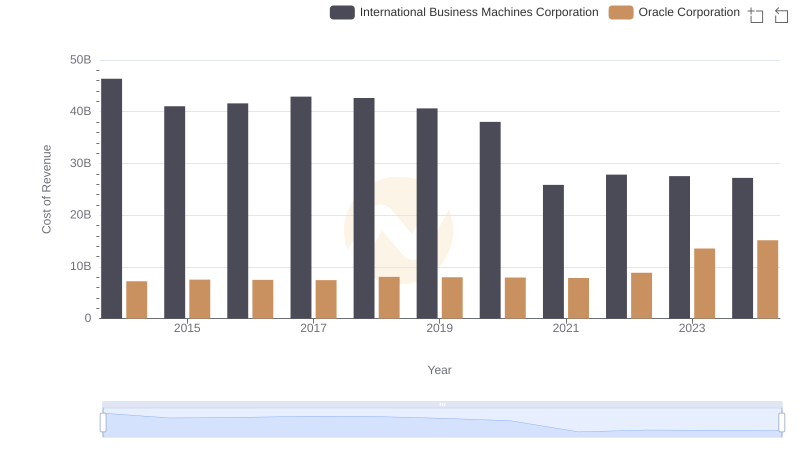
Cost of Revenue Comparison: Oracle Corporation vs International Business Machines Corporation
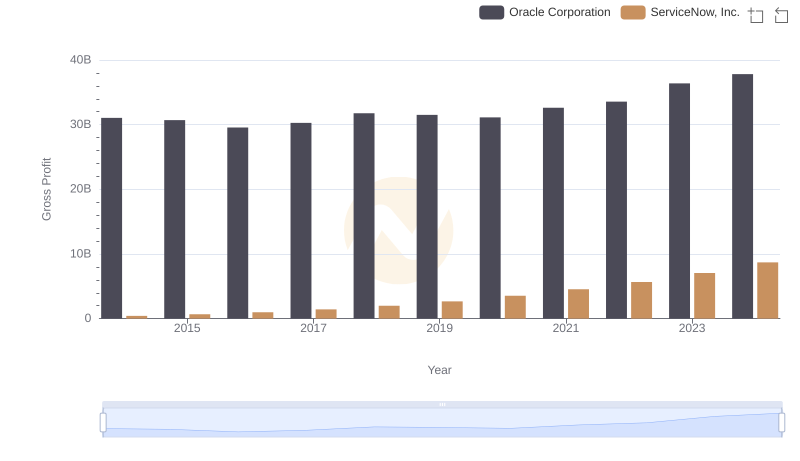
Who Generates Higher Gross Profit? Oracle Corporation or ServiceNow, Inc.
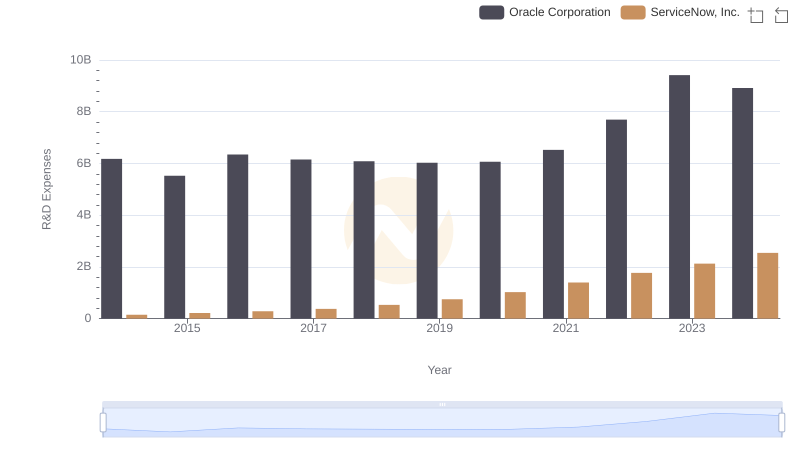
Research and Development Expenses Breakdown: Oracle Corporation vs ServiceNow, Inc.
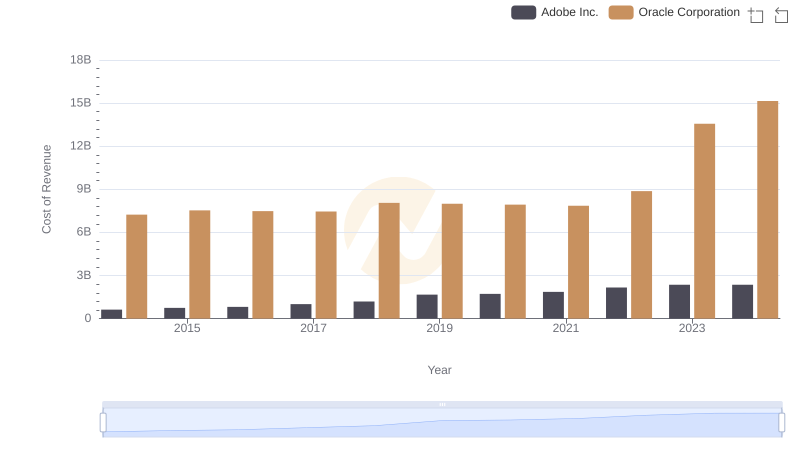
Oracle Corporation vs Adobe Inc.: Efficiency in Cost of Revenue Explored
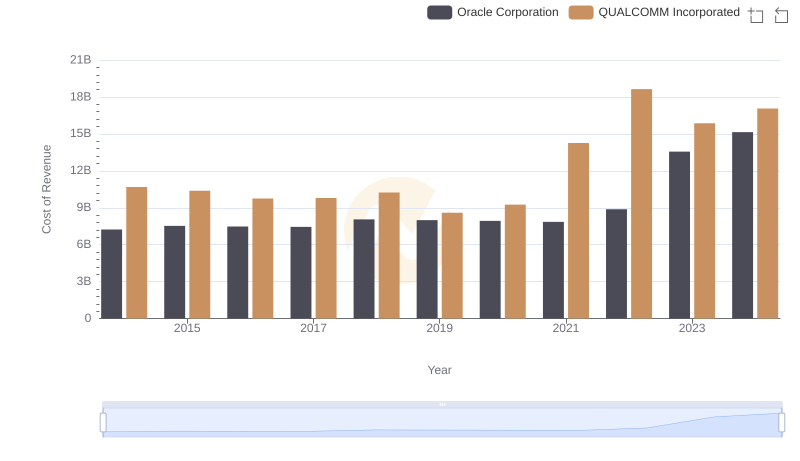
Analyzing Cost of Revenue: Oracle Corporation and QUALCOMM Incorporated
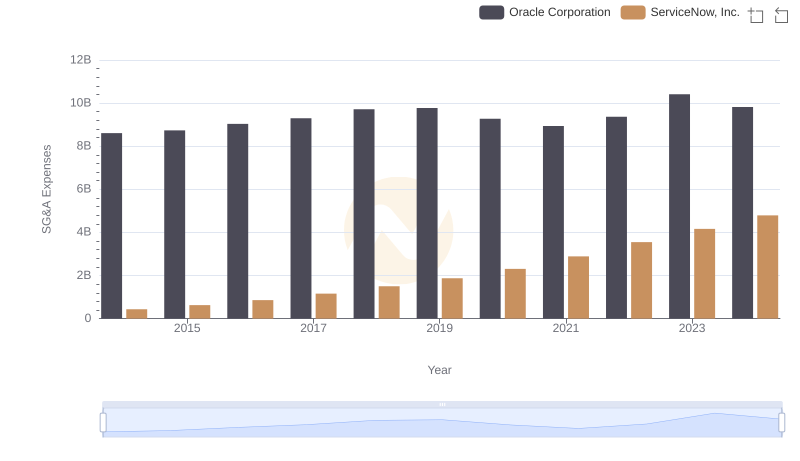
Operational Costs Compared: SG&A Analysis of Oracle Corporation and ServiceNow, Inc.