| __timestamp | Corning Incorporated | Infosys Limited |
|---|---|---|
| Wednesday, January 1, 2014 | 815000000 | 110000000 |
| Thursday, January 1, 2015 | 769000000 | 108750722 |
| Friday, January 1, 2016 | 742000000 | 117660969 |
| Sunday, January 1, 2017 | 860000000 | 116030068 |
| Monday, January 1, 2018 | 993000000 | 109947154 |
| Tuesday, January 1, 2019 | 1031000000 | 116915374 |
| Wednesday, January 1, 2020 | 1154000000 | 127298402 |
| Friday, January 1, 2021 | 995000000 | 70997544 |
| Saturday, January 1, 2022 | 1047000000 | 129656701 |
| Sunday, January 1, 2023 | 1076000000 | 135037609 |
| Monday, January 1, 2024 | 1089000000 |
In pursuit of knowledge
In the ever-evolving landscape of technology and innovation, research and development (R&D) spending is a critical indicator of a company's commitment to future growth. This chart provides a fascinating glimpse into how two industry leaders, Infosys Limited and Corning Incorporated, have allocated their R&D funds over the past decade.
From 2014 to 2023, Corning Incorporated consistently invested a significant portion of its resources into R&D, with expenditures peaking in 2020 at approximately 1.15 billion USD. This represents a robust 55% increase from its 2014 spending. In contrast, Infosys Limited, a titan in the IT services sector, demonstrated a more modest growth trajectory, with R&D expenses rising by about 23% over the same period, reaching their highest in 2023.
Interestingly, the data for 2024 is incomplete, highlighting the dynamic nature of financial reporting and the need for continuous monitoring of these trends.
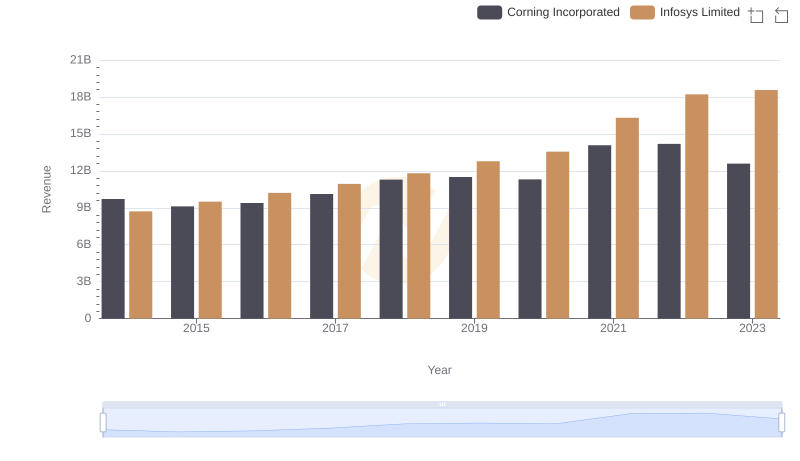
Infosys Limited vs Corning Incorporated: Examining Key Revenue Metrics
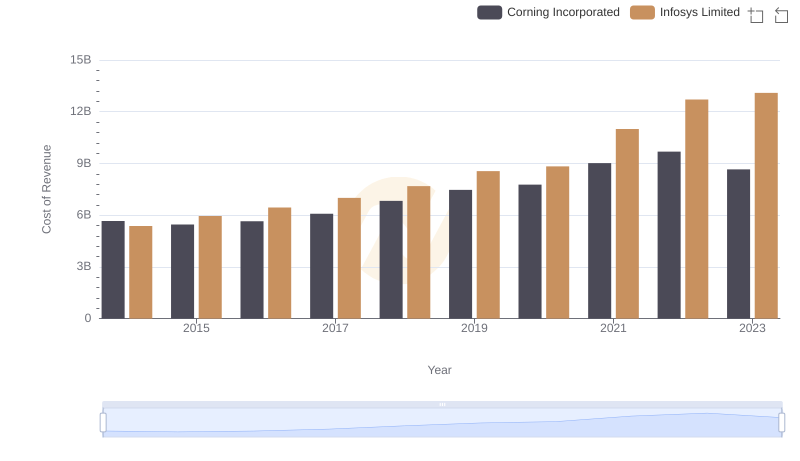
Infosys Limited vs Corning Incorporated: Efficiency in Cost of Revenue Explored
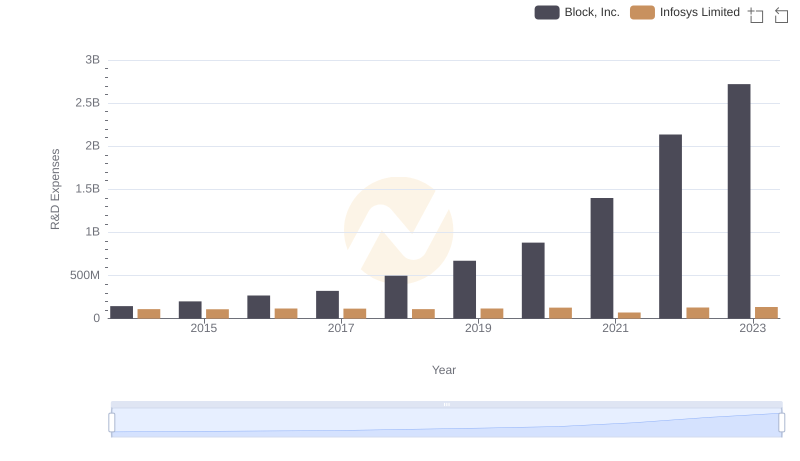
R&D Insights: How Infosys Limited and Block, Inc. Allocate Funds
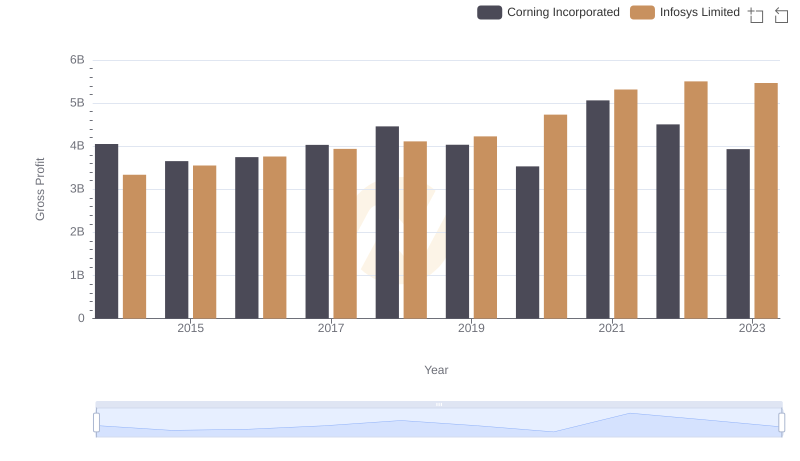
Infosys Limited vs Corning Incorporated: A Gross Profit Performance Breakdown
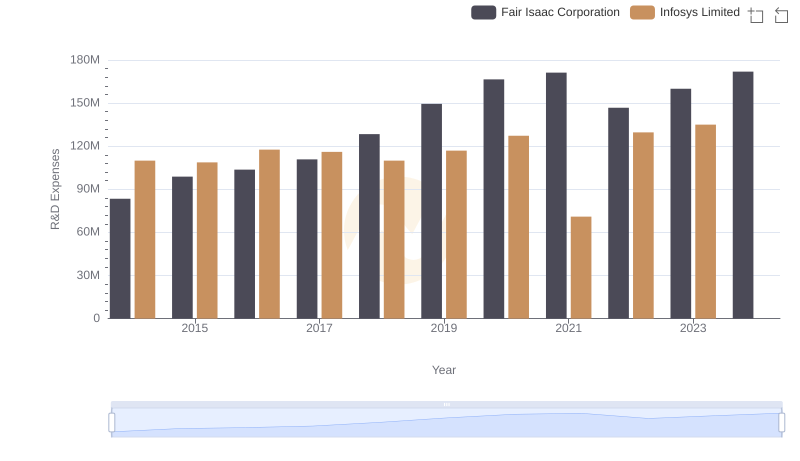
Research and Development Expenses Breakdown: Infosys Limited vs Fair Isaac Corporation
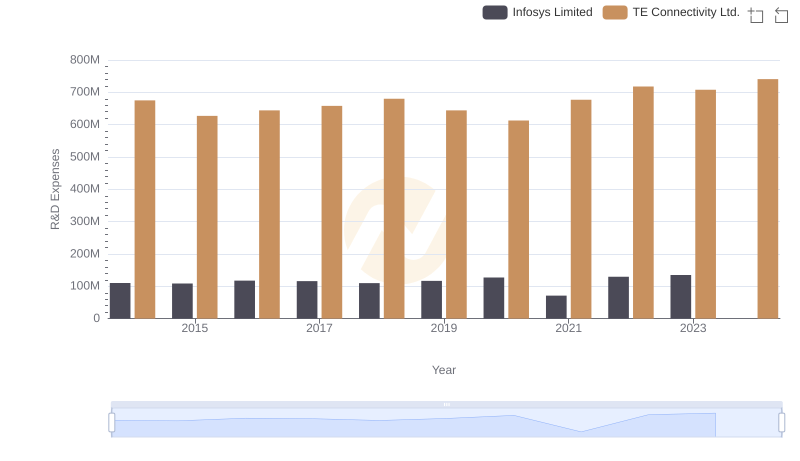
Comparing Innovation Spending: Infosys Limited and TE Connectivity Ltd.
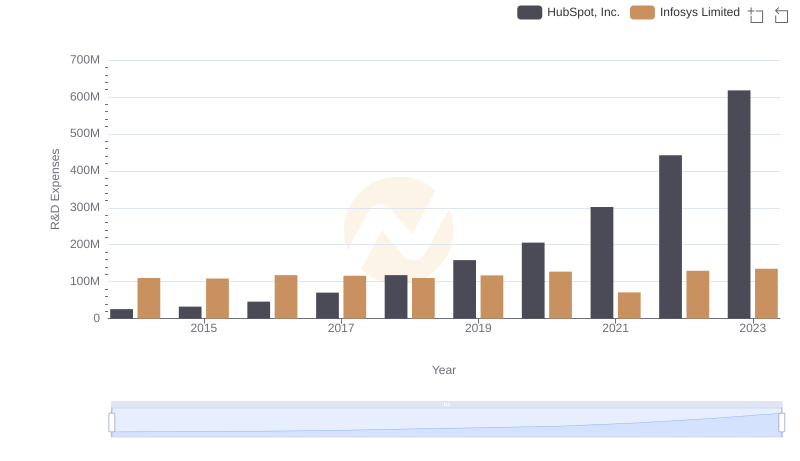
Infosys Limited vs HubSpot, Inc.: Strategic Focus on R&D Spending
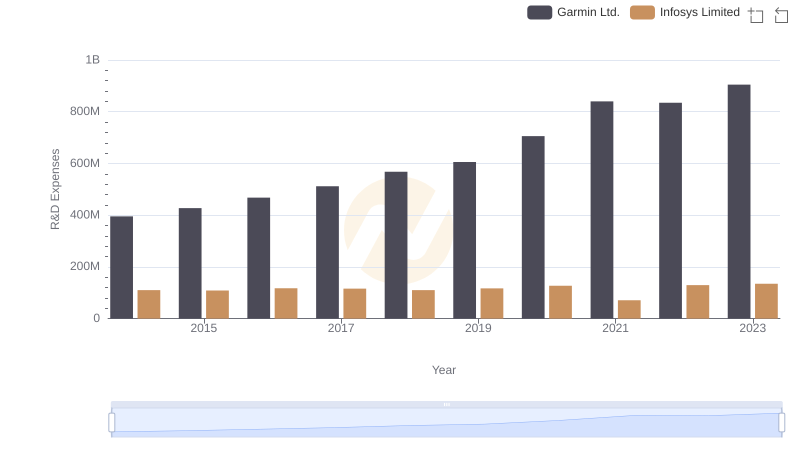
R&D Insights: How Infosys Limited and Garmin Ltd. Allocate Funds
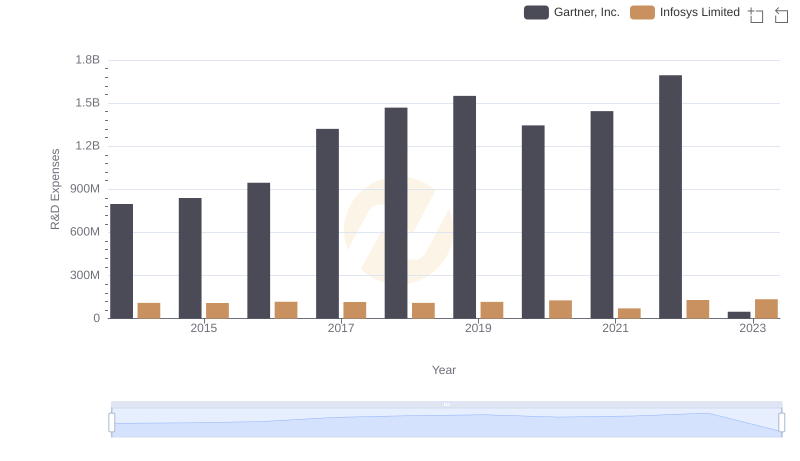
Research and Development Expenses Breakdown: Infosys Limited vs Gartner, Inc.
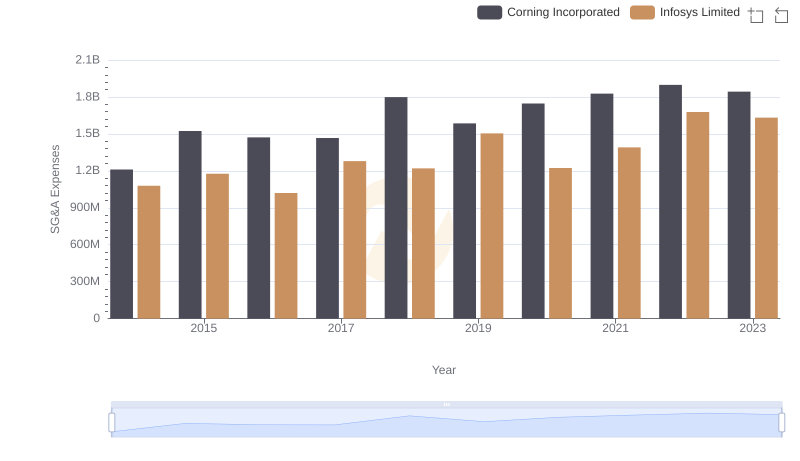
Selling, General, and Administrative Costs: Infosys Limited vs Corning Incorporated
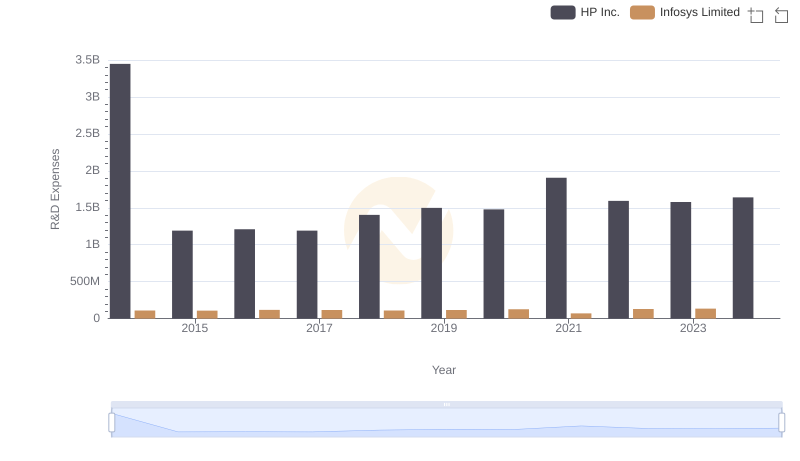
Who Prioritizes Innovation? R&D Spending Compared for Infosys Limited and HP Inc.
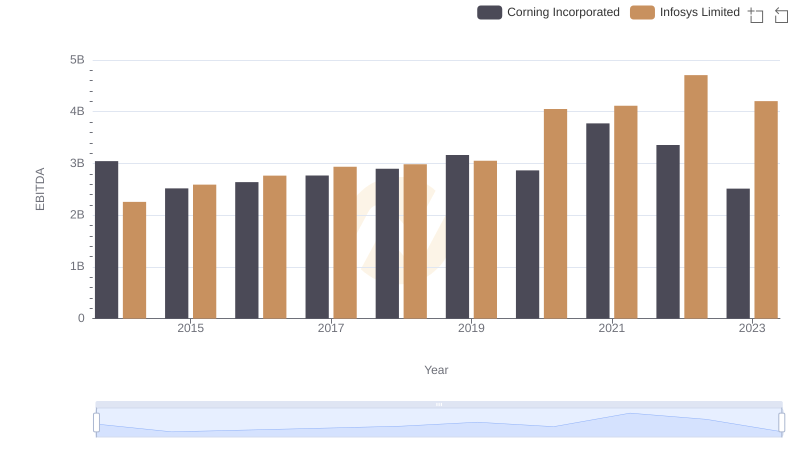
Comprehensive EBITDA Comparison: Infosys Limited vs Corning Incorporated