| __timestamp | Corning Incorporated | Infosys Limited |
|---|---|---|
| Wednesday, January 1, 2014 | 4052000000 | 3337000000 |
| Thursday, January 1, 2015 | 3653000000 | 3551000000 |
| Friday, January 1, 2016 | 3746000000 | 3762000000 |
| Sunday, January 1, 2017 | 4032000000 | 3938000000 |
| Monday, January 1, 2018 | 4461000000 | 4112000000 |
| Tuesday, January 1, 2019 | 4035000000 | 4228000000 |
| Wednesday, January 1, 2020 | 3531000000 | 4733000000 |
| Friday, January 1, 2021 | 5063000000 | 5315000000 |
| Saturday, January 1, 2022 | 4506000000 | 5503000000 |
| Sunday, January 1, 2023 | 3931000000 | 5466000000 |
| Monday, January 1, 2024 | 4276000000 |
Unveiling the hidden dimensions of data
In the ever-evolving landscape of global business, the financial performance of companies like Infosys Limited and Corning Incorporated offers a fascinating glimpse into industry dynamics. Over the past decade, from 2014 to 2023, these two giants have showcased contrasting trajectories in their gross profit margins.
Infosys Limited, a leader in IT services, has demonstrated a robust upward trend, with its gross profit surging by approximately 64% from 2014 to 2023. This growth reflects the increasing demand for digital transformation services worldwide. In contrast, Corning Incorporated, renowned for its innovations in materials science, experienced a more volatile journey. Despite a peak in 2021, Corning's gross profit in 2023 was roughly 3% lower than in 2014, highlighting the challenges faced in the manufacturing sector.
This comparative analysis underscores the resilience of the tech industry and the cyclical nature of manufacturing, offering valuable insights for investors and industry watchers alike.
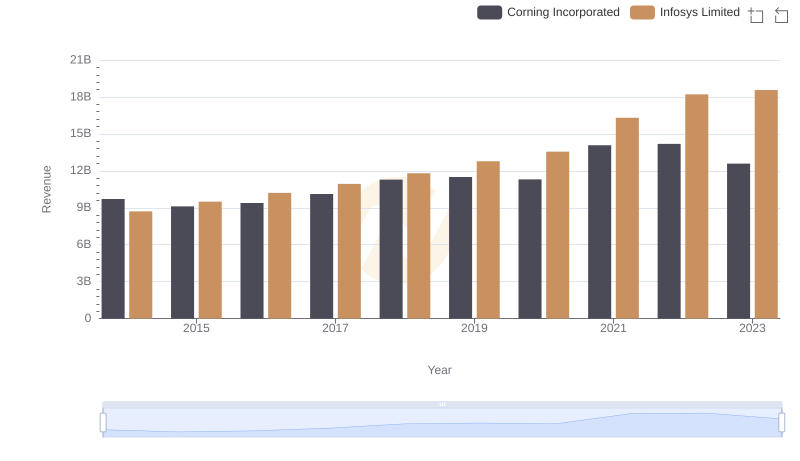
Infosys Limited vs Corning Incorporated: Examining Key Revenue Metrics
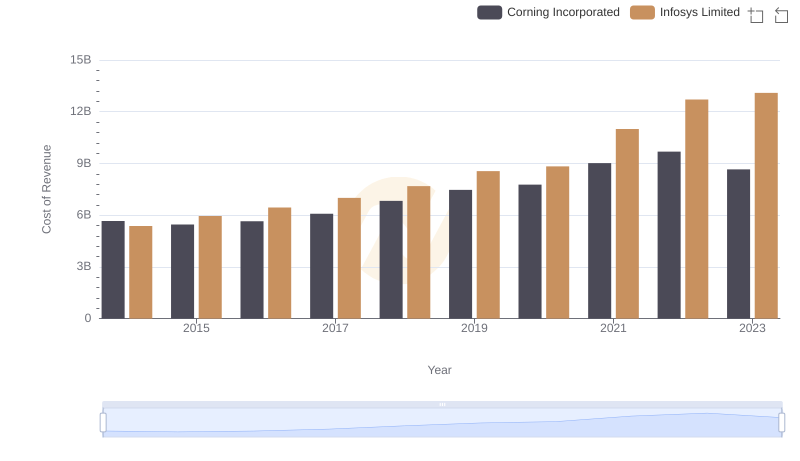
Infosys Limited vs Corning Incorporated: Efficiency in Cost of Revenue Explored
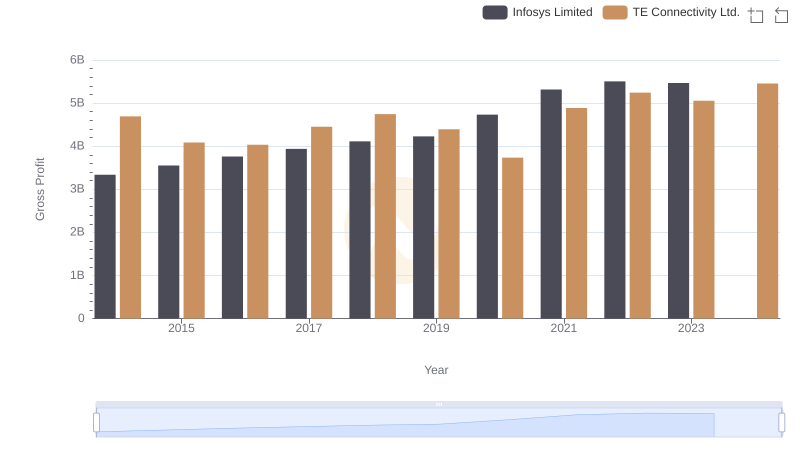
Who Generates Higher Gross Profit? Infosys Limited or TE Connectivity Ltd.
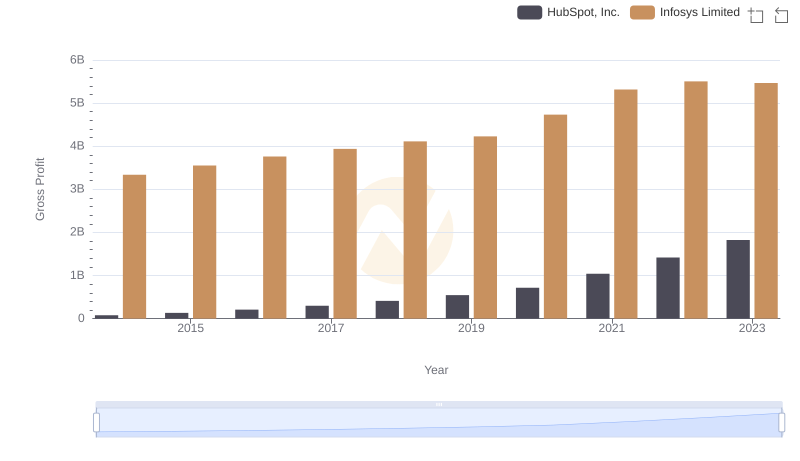
Gross Profit Comparison: Infosys Limited and HubSpot, Inc. Trends
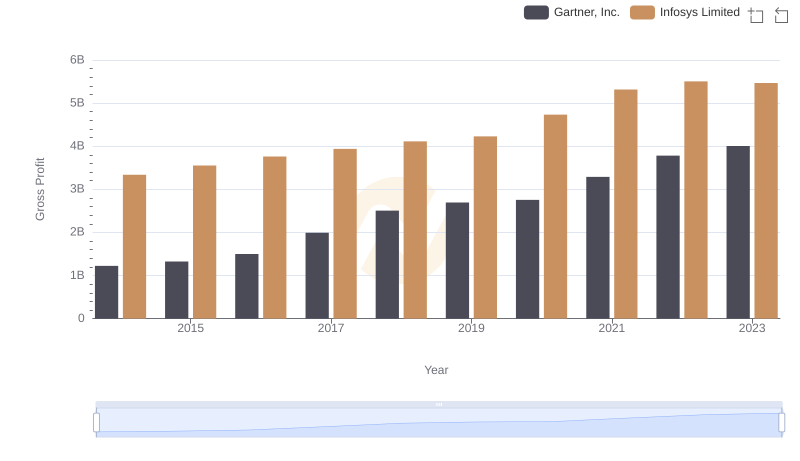
Gross Profit Comparison: Infosys Limited and Gartner, Inc. Trends
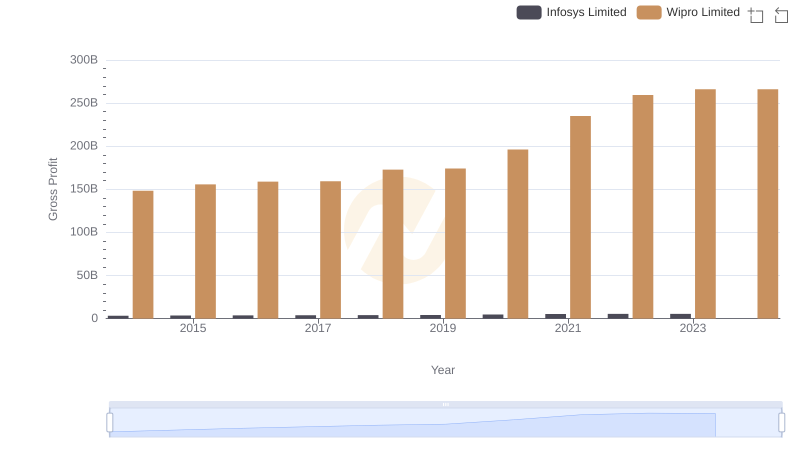
Gross Profit Trends Compared: Infosys Limited vs Wipro Limited
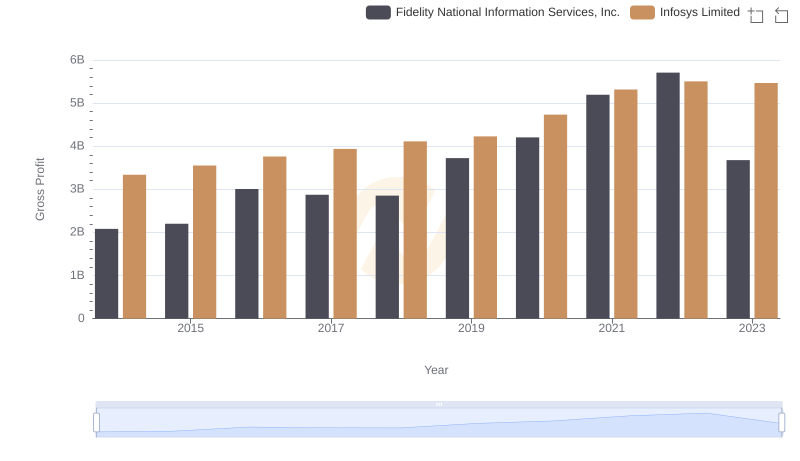
Who Generates Higher Gross Profit? Infosys Limited or Fidelity National Information Services, Inc.
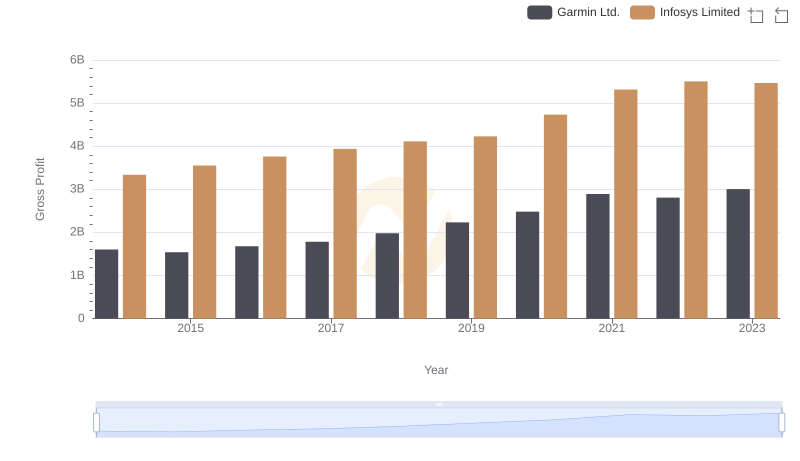
Key Insights on Gross Profit: Infosys Limited vs Garmin Ltd.
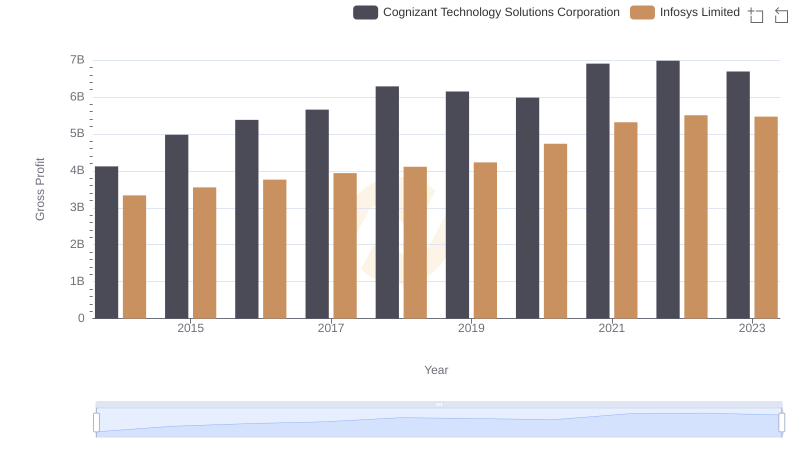
Infosys Limited and Cognizant Technology Solutions Corporation: A Detailed Gross Profit Analysis
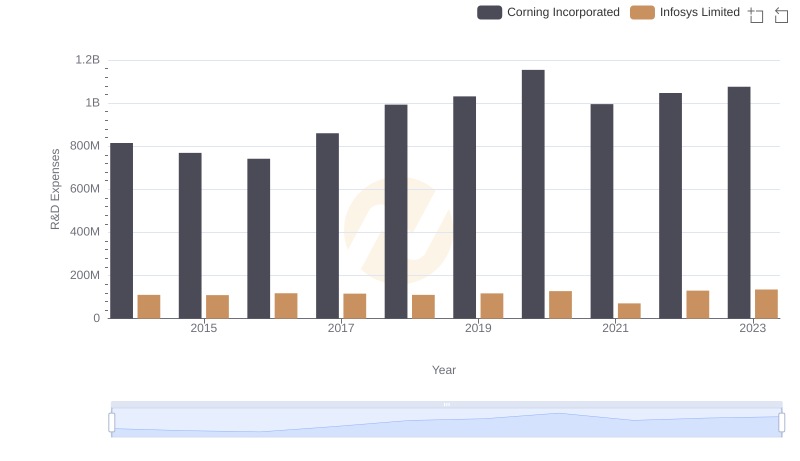
R&D Insights: How Infosys Limited and Corning Incorporated Allocate Funds
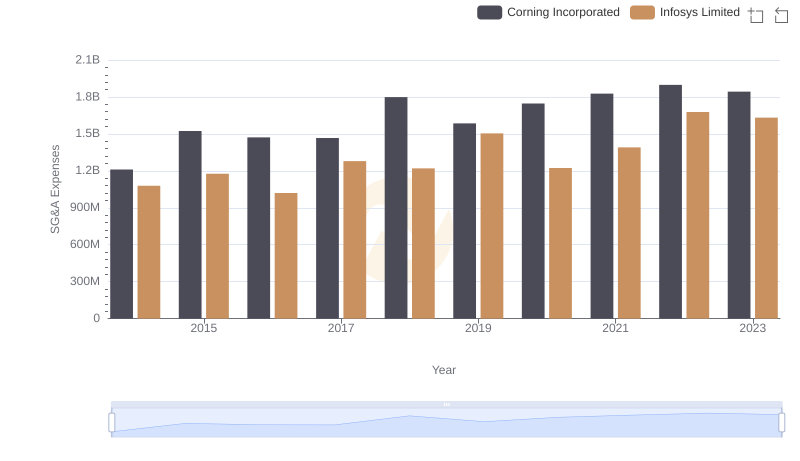
Selling, General, and Administrative Costs: Infosys Limited vs Corning Incorporated
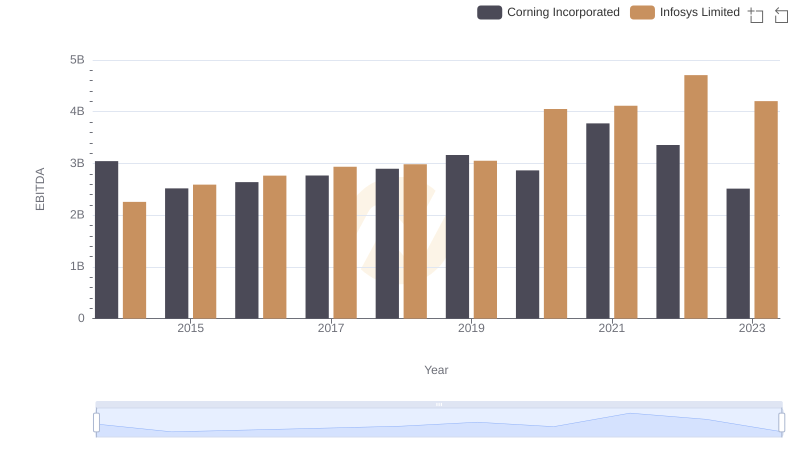
Comprehensive EBITDA Comparison: Infosys Limited vs Corning Incorporated