| __timestamp | Howmet Aerospace Inc. | TFI International Inc. |
|---|---|---|
| Wednesday, January 1, 2014 | 1927000000 | 334908602 |
| Thursday, January 1, 2015 | 1936000000 | 314924803 |
| Friday, January 1, 2016 | 1457000000 | 325584405 |
| Sunday, January 1, 2017 | 1517000000 | 517899005 |
| Monday, January 1, 2018 | 1491000000 | 521265317 |
| Tuesday, January 1, 2019 | 843000000 | 674440000 |
| Wednesday, January 1, 2020 | 831000000 | 709296000 |
| Friday, January 1, 2021 | 1095000000 | 1358717000 |
| Saturday, January 1, 2022 | 1260000000 | 1561728000 |
| Sunday, January 1, 2023 | 1465000000 | 1194213000 |
| Monday, January 1, 2024 | 1842000000 |
Igniting the spark of knowledge
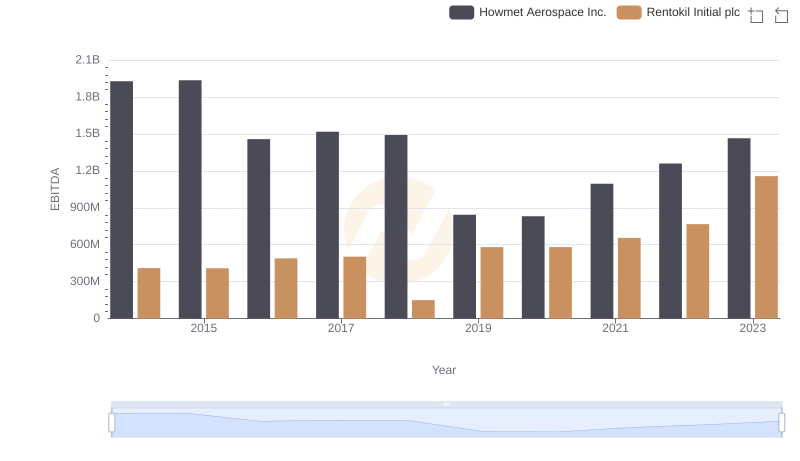
In the competitive landscape of aerospace and logistics, Howmet Aerospace Inc. and TFI International Inc. have showcased intriguing financial trajectories over the past decade. From 2014 to 2023, Howmet Aerospace's EBITDA fluctuated, peaking in 2015 with a 40% higher value than its 2019 low. Meanwhile, TFI International demonstrated a robust growth trajectory, with its EBITDA surging by nearly 370% from 2014 to 2022. This remarkable growth underscores TFI's strategic expansions and operational efficiencies. Notably, in 2021, TFI's EBITDA surpassed Howmet's for the first time, marking a pivotal shift in industry dynamics. As we delve into these financial narratives, it's evident that strategic adaptability and market positioning play crucial roles in shaping corporate success. This analysis offers valuable insights for investors and industry stakeholders aiming to understand the evolving economic landscape of these two industry leaders.

Howmet Aerospace Inc. and TFI International Inc.: A Comprehensive Revenue Analysis
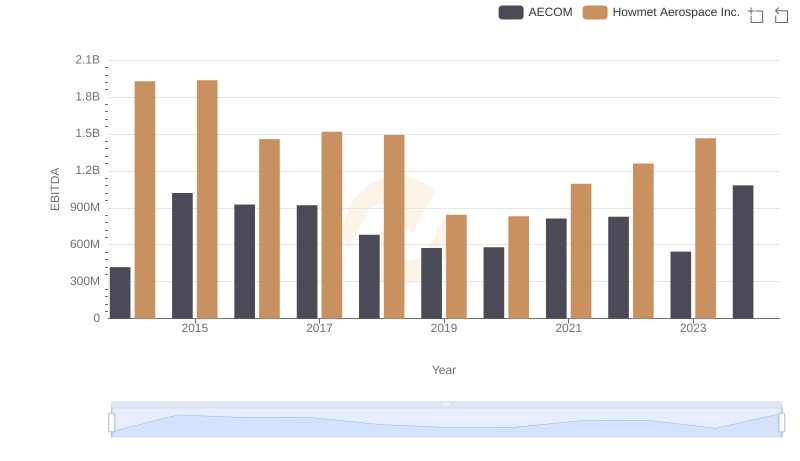
Howmet Aerospace Inc. and AECOM: A Detailed Examination of EBITDA Performance
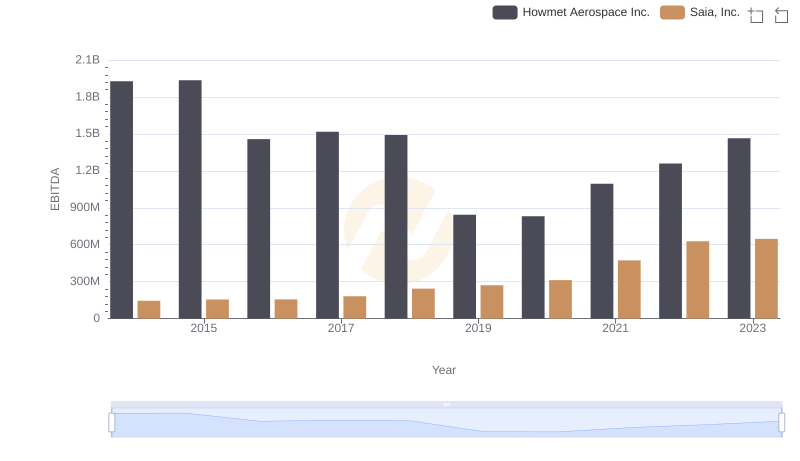
EBITDA Performance Review: Howmet Aerospace Inc. vs Saia, Inc.
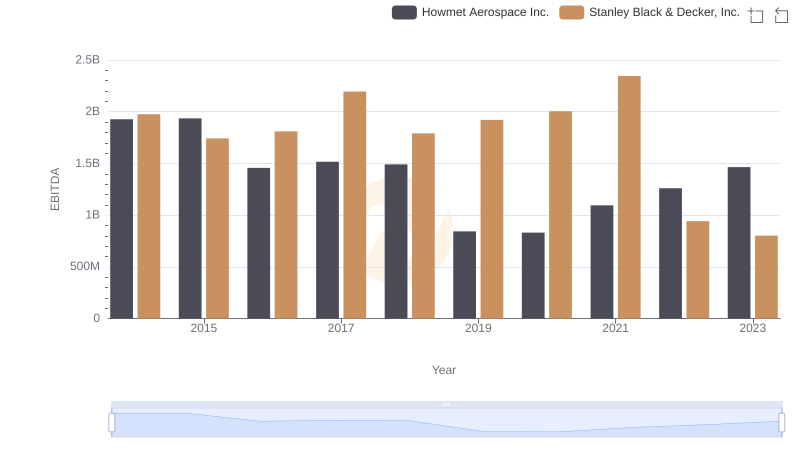
Howmet Aerospace Inc. and Stanley Black & Decker, Inc.: A Detailed Examination of EBITDA Performance
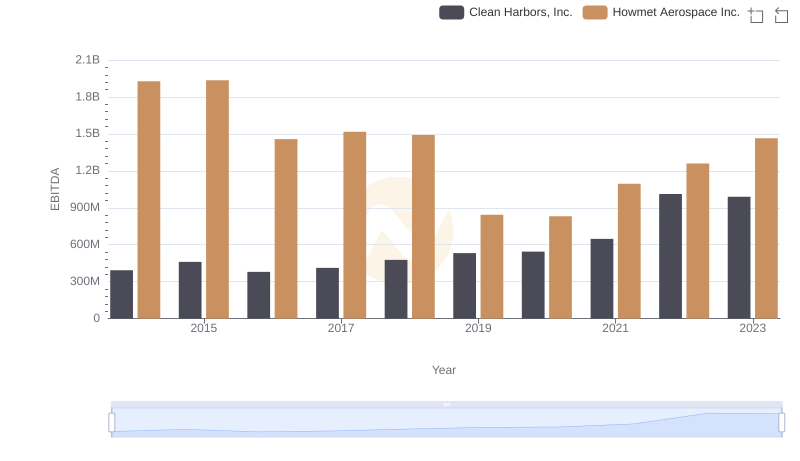
EBITDA Performance Review: Howmet Aerospace Inc. vs Clean Harbors, Inc.
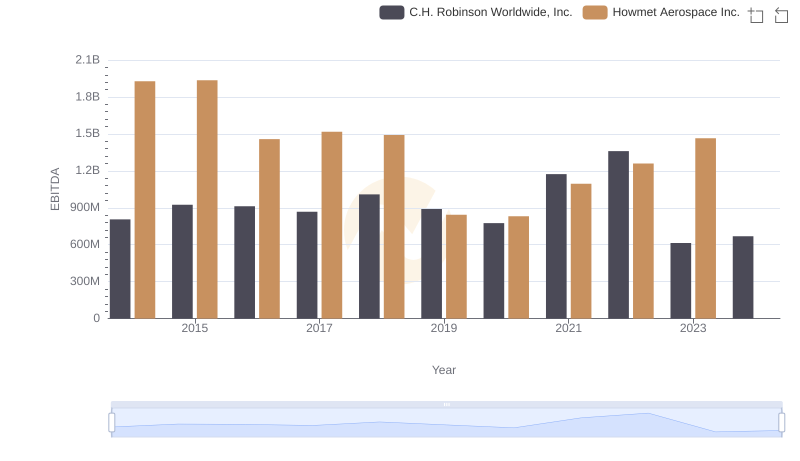
A Side-by-Side Analysis of EBITDA: Howmet Aerospace Inc. and C.H. Robinson Worldwide, Inc.
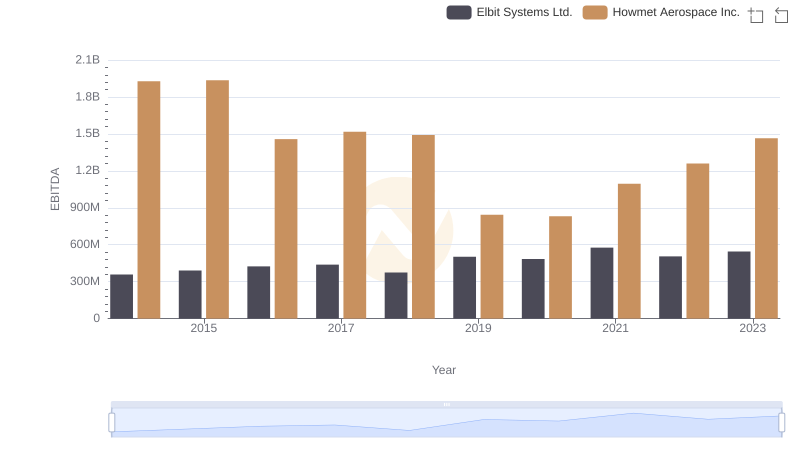
EBITDA Analysis: Evaluating Howmet Aerospace Inc. Against Elbit Systems Ltd.
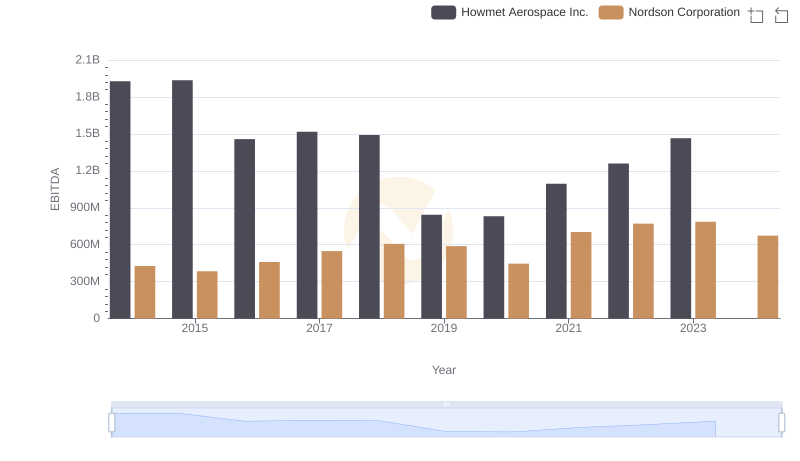
A Side-by-Side Analysis of EBITDA: Howmet Aerospace Inc. and Nordson Corporation
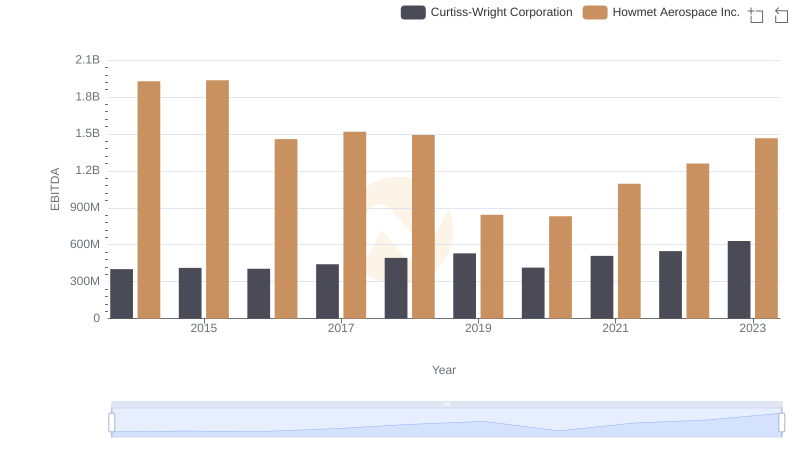
Comprehensive EBITDA Comparison: Howmet Aerospace Inc. vs Curtiss-Wright Corporation
Comparative EBITDA Analysis: Howmet Aerospace Inc. vs Rentokil Initial plc