| __timestamp | Howmet Aerospace Inc. | Nordson Corporation |
|---|---|---|
| Wednesday, January 1, 2014 | 1927000000 | 427302000 |
| Thursday, January 1, 2015 | 1936000000 | 384160000 |
| Friday, January 1, 2016 | 1457000000 | 460120000 |
| Sunday, January 1, 2017 | 1517000000 | 547746000 |
| Monday, January 1, 2018 | 1491000000 | 606502000 |
| Tuesday, January 1, 2019 | 843000000 | 588493000 |
| Wednesday, January 1, 2020 | 831000000 | 446951000 |
| Friday, January 1, 2021 | 1095000000 | 703550000 |
| Saturday, January 1, 2022 | 1260000000 | 771615000 |
| Sunday, January 1, 2023 | 1465000000 | 786742000 |
| Monday, January 1, 2024 | 1842000000 | 674001000 |
Unveiling the hidden dimensions of data
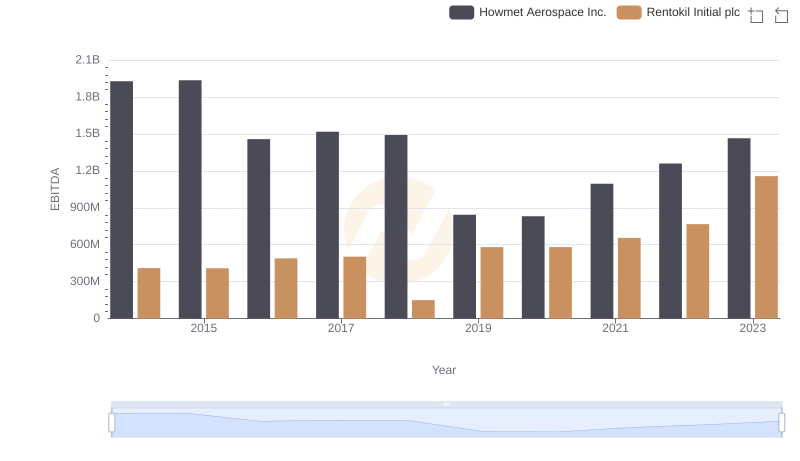
In the ever-evolving landscape of aerospace and industrial manufacturing, understanding financial health is crucial. This analysis delves into the EBITDA performance of Howmet Aerospace Inc. and Nordson Corporation from 2014 to 2023. Howmet Aerospace, a leader in advanced engineering solutions, consistently outperformed Nordson, with EBITDA peaking at approximately $1.9 billion in 2015. Despite a dip in 2019, Howmet's EBITDA rebounded by 76% by 2023. Meanwhile, Nordson, renowned for its precision technology, showed steady growth, with EBITDA increasing by 84% from 2014 to 2023, reaching around $787 million. Notably, 2024 data for Howmet is missing, highlighting the importance of complete datasets for accurate analysis. This side-by-side comparison underscores the resilience and strategic prowess of these industry giants, offering valuable insights for investors and stakeholders.

Howmet Aerospace Inc. vs Nordson Corporation: Examining Key Revenue Metrics
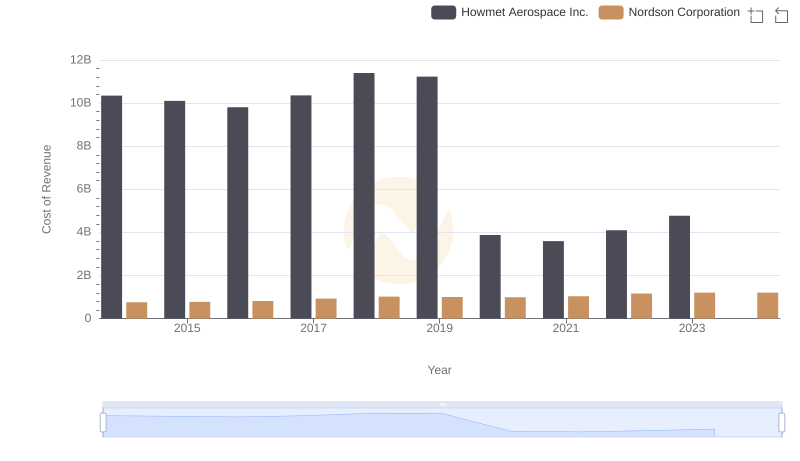
Cost of Revenue Comparison: Howmet Aerospace Inc. vs Nordson Corporation
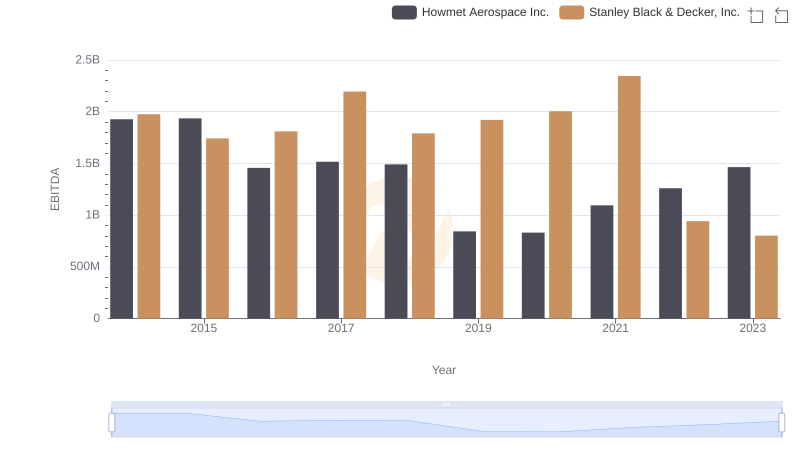
Howmet Aerospace Inc. and Stanley Black & Decker, Inc.: A Detailed Examination of EBITDA Performance
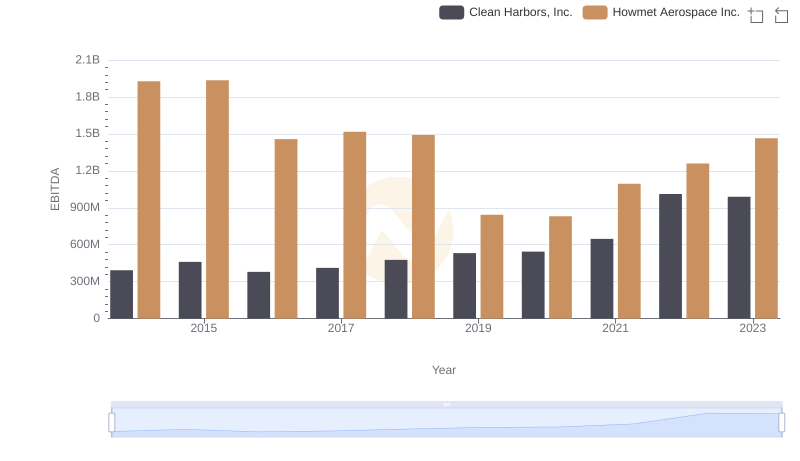
EBITDA Performance Review: Howmet Aerospace Inc. vs Clean Harbors, Inc.
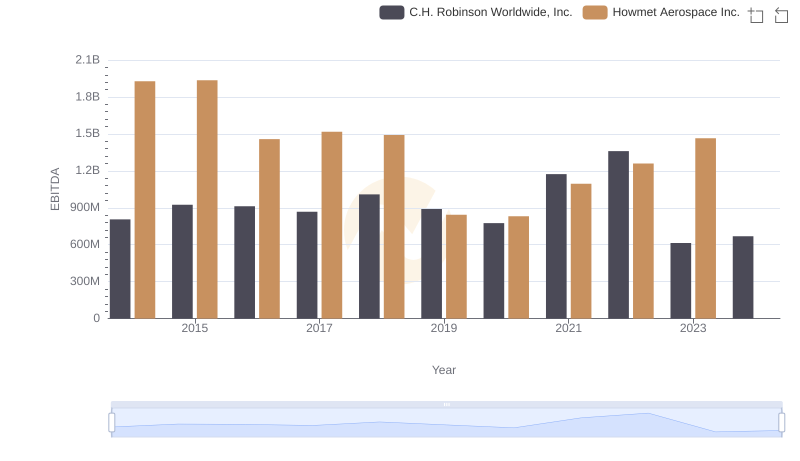
A Side-by-Side Analysis of EBITDA: Howmet Aerospace Inc. and C.H. Robinson Worldwide, Inc.
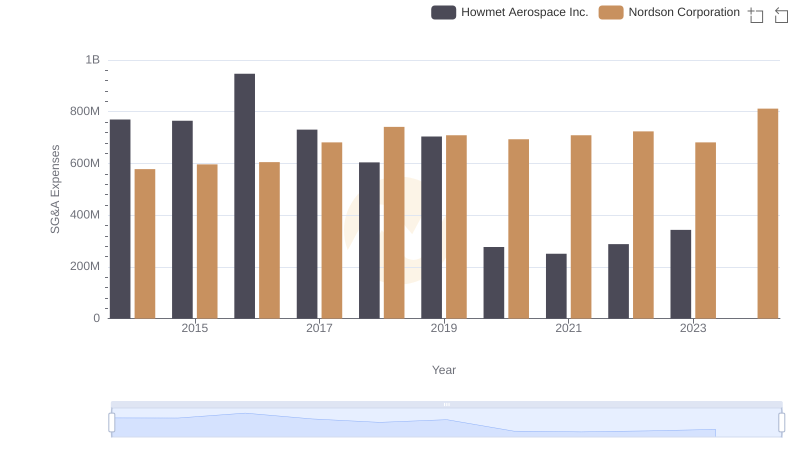
SG&A Efficiency Analysis: Comparing Howmet Aerospace Inc. and Nordson Corporation
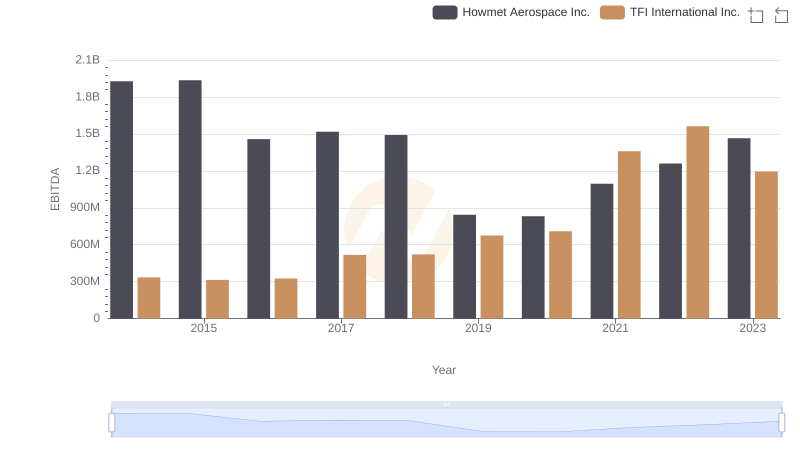
Professional EBITDA Benchmarking: Howmet Aerospace Inc. vs TFI International Inc.
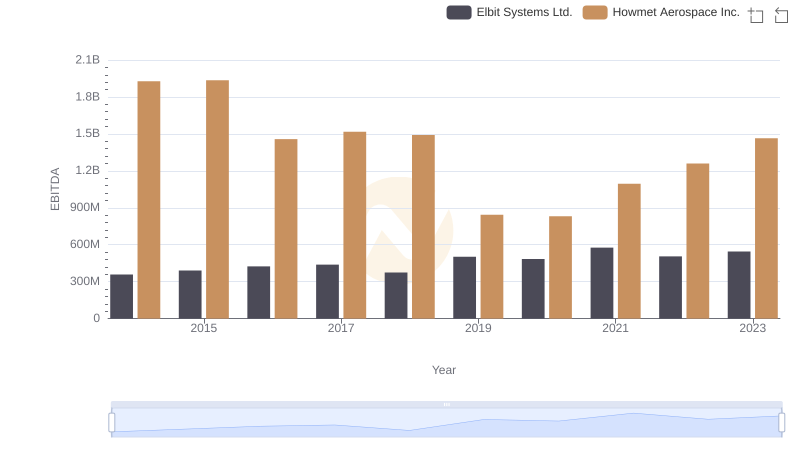
EBITDA Analysis: Evaluating Howmet Aerospace Inc. Against Elbit Systems Ltd.
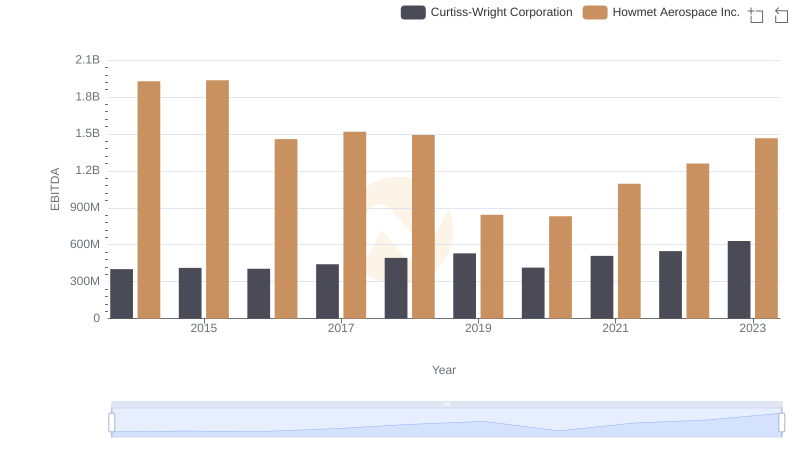
Comprehensive EBITDA Comparison: Howmet Aerospace Inc. vs Curtiss-Wright Corporation
Comparative EBITDA Analysis: Howmet Aerospace Inc. vs Rentokil Initial plc