| __timestamp | Autodesk, Inc. | Block, Inc. |
|---|---|---|
| Wednesday, January 1, 2014 | 1090900000 | 206797000 |
| Thursday, January 1, 2015 | 1281300000 | 289084000 |
| Friday, January 1, 2016 | 1308900000 | 425869000 |
| Sunday, January 1, 2017 | 1310300000 | 503723000 |
| Monday, January 1, 2018 | 1392500000 | 750396000 |
| Tuesday, January 1, 2019 | 1524000000 | 1061082000 |
| Wednesday, January 1, 2020 | 1715900000 | 1688873000 |
| Friday, January 1, 2021 | 1854200000 | 2600515000 |
| Saturday, January 1, 2022 | 2194800000 | 3744800000 |
| Sunday, January 1, 2023 | 2277000000 | 4228199000 |
| Monday, January 1, 2024 | 2443000000 |
In pursuit of knowledge
In the ever-evolving landscape of technology, operational efficiency is paramount. Over the past decade, Autodesk, Inc. and Block, Inc. have showcased contrasting trajectories in their Selling, General, and Administrative (SG&A) expenses. From 2014 to 2023, Autodesk's SG&A expenses have grown steadily, peaking at approximately 2.4 billion in 2023, marking a 124% increase from 2014. In contrast, Block, Inc. has experienced a more dramatic rise, with expenses surging by over 1,900% from 2014 to 2023, reaching around 4.2 billion. This stark difference highlights Block's aggressive expansion strategy compared to Autodesk's more measured approach. Notably, data for 2024 is incomplete, with Block's figures yet to be reported. As these companies continue to innovate, their financial strategies will undoubtedly play a crucial role in shaping their futures.
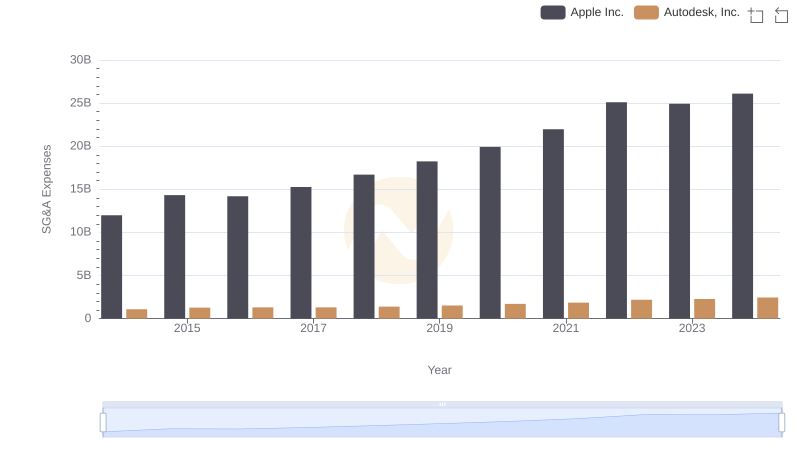
Cost Management Insights: SG&A Expenses for Apple Inc. and Autodesk, Inc.
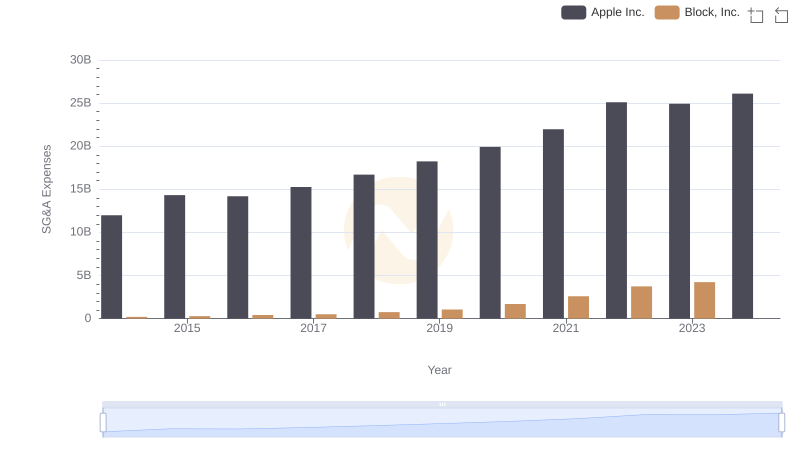
Selling, General, and Administrative Costs: Apple Inc. vs Block, Inc.
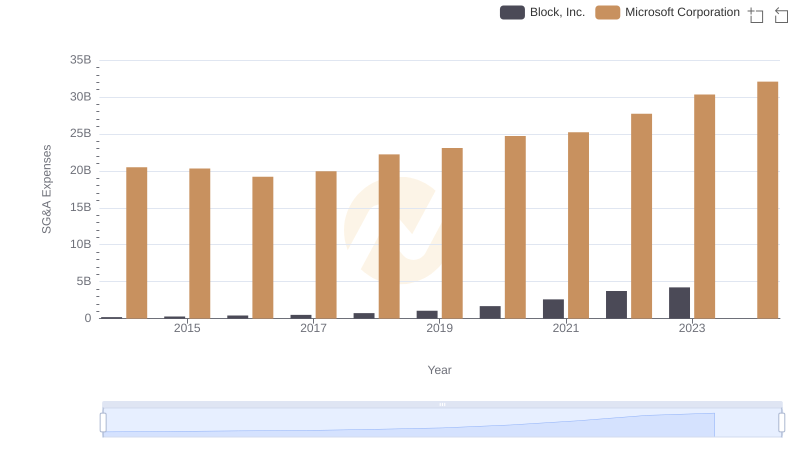
SG&A Efficiency Analysis: Comparing Microsoft Corporation and Block, Inc.
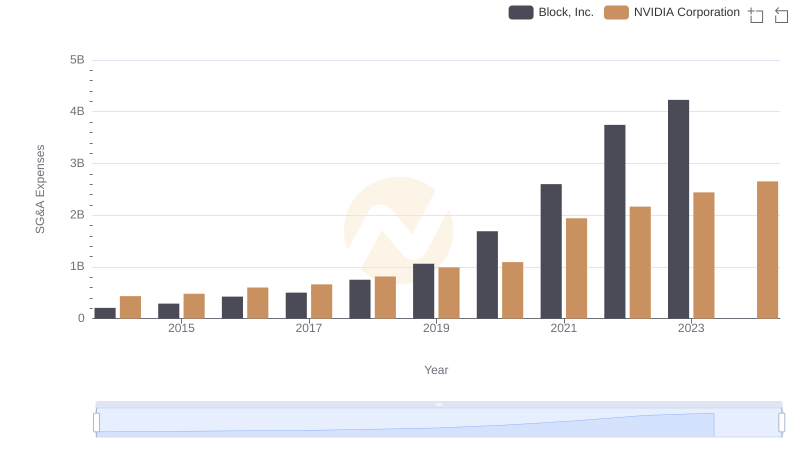
NVIDIA Corporation or Block, Inc.: Who Manages SG&A Costs Better?
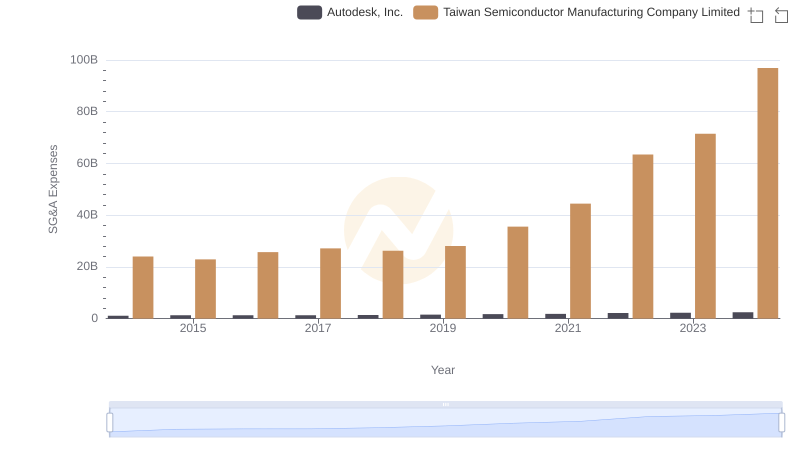
Operational Costs Compared: SG&A Analysis of Taiwan Semiconductor Manufacturing Company Limited and Autodesk, Inc.
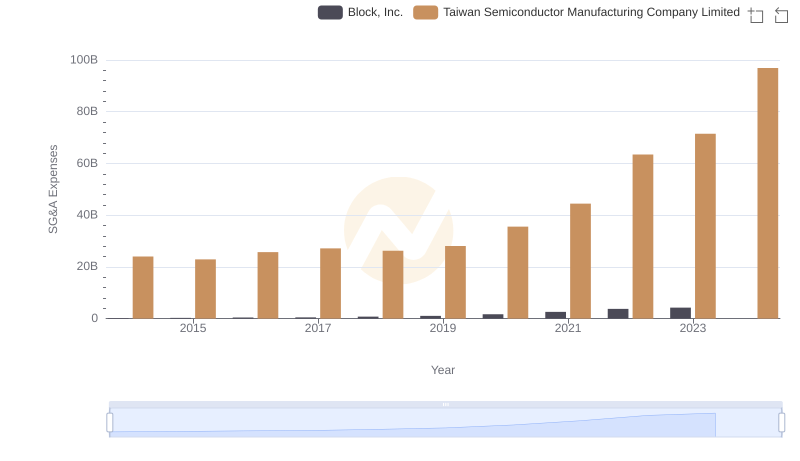
Taiwan Semiconductor Manufacturing Company Limited or Block, Inc.: Who Manages SG&A Costs Better?
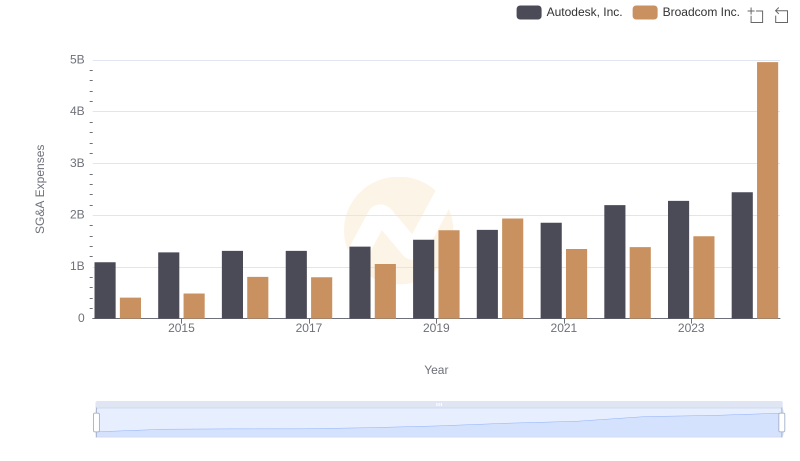
Who Optimizes SG&A Costs Better? Broadcom Inc. or Autodesk, Inc.
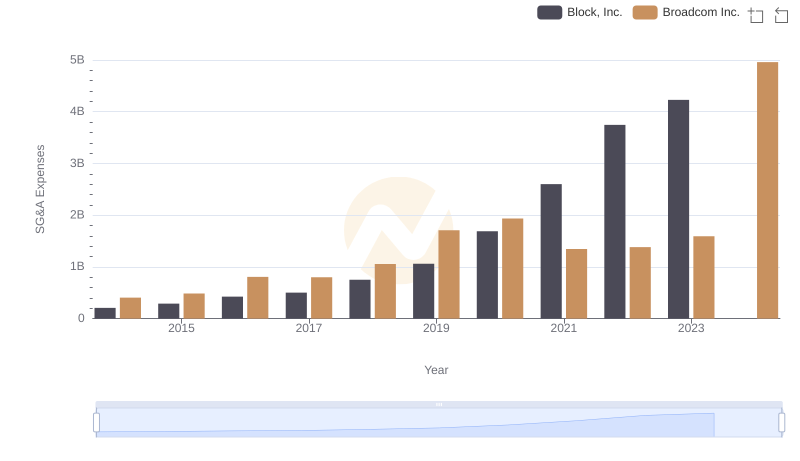
Broadcom Inc. vs Block, Inc.: SG&A Expense Trends
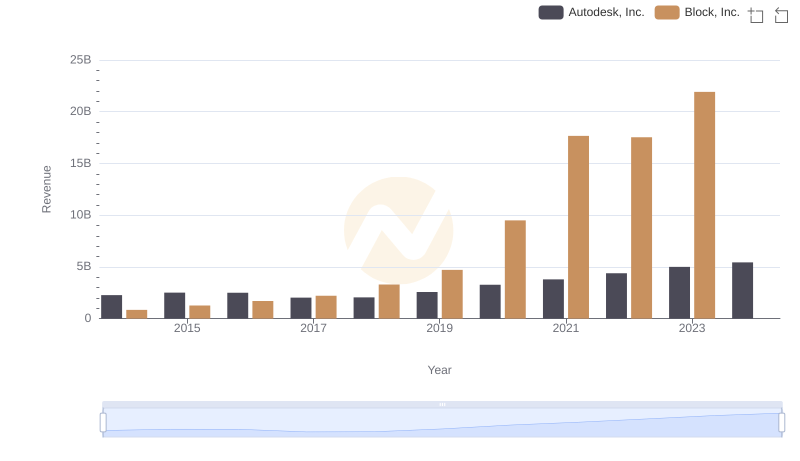
Revenue Insights: Autodesk, Inc. and Block, Inc. Performance Compared

Comparing Cost of Revenue Efficiency: Autodesk, Inc. vs Block, Inc.
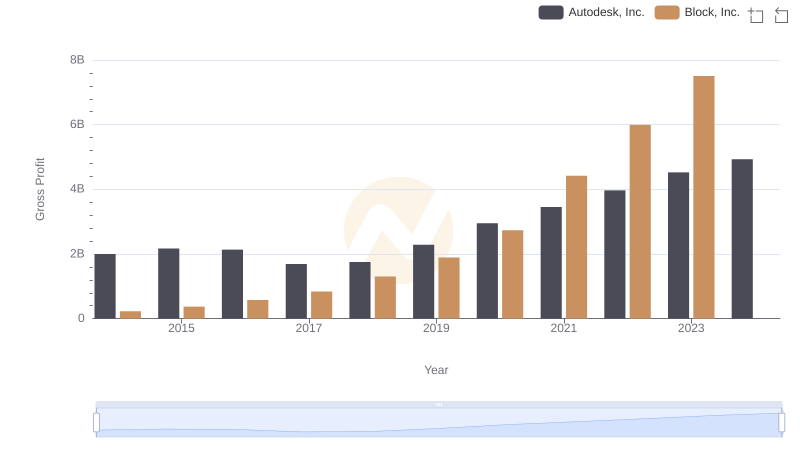
Gross Profit Comparison: Autodesk, Inc. and Block, Inc. Trends
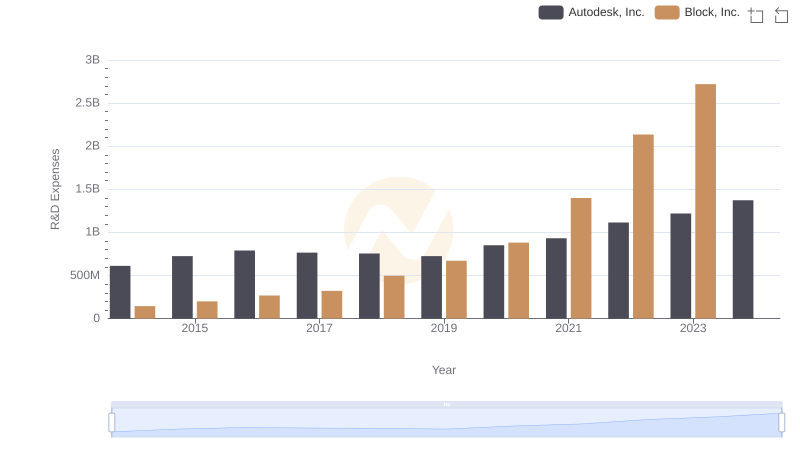
Research and Development Investment: Autodesk, Inc. vs Block, Inc.